Work-Related Amputations with Days Away From Work Reported by Employers
Amputations are preventable and debilitating injuries that lead to losses in productivity and income. Although work-related amputations, both fatal and non-fatal, occur less frequently than other work-related injuries, they are often more severe and impact both the worker and employer more profoundly.
Review of these injuries and tracking of these events can provide critical information for the development and improvement of prevention strategies and regulations to protect workers.
Two indicators measure the number of amputations that occur due to work-related activities: amputations recorded by employers and amputations that involve workers’ compensation claims. While these two indicators measure similar outcomes, the data used to compile/create each indicator will produce different estimates of the number of amputations with lost work time. These differences are due in part to the methods in which data are collected and recorded. To obtain the best picture of the number of amputations with lost work time, both indicators are necessary.
The amputation indicator shown here are those reported by employers. Estimates of employer reported amputations are available from the Survey of Occupational Injuries and Illnesses (SOII), conducted annually by the Bureau of Labor Statistics (BLS) in collaboration with the states. The SOII collects data on non-fatal injuries and illnesses for each calendar year from a sample of employers. However, SOII does not include small farms, federal employees, self-employed, and household workers. The employers are required to provide information on injury or illness cases that result in one or more lost workdays, restricted work activity, job transfer, loss of consciousness, or require medical treatment (other than first aid). National and state data are available from the BLS web site. In Minnesota, the Department of Labor and Industry (DLI) compiles these cases and reports on an annual basis and the data are presented in great detail in DLI’s annual Minnesota Workplace Safety Report. The National Institute of Occupational Safety and Health (NIOSH) provides information on the national magnitude and trend of work-related amputations.
In 2014 in the U.S., 4,900 non-fatal amputations were reported by private sector. From 2003 to 2008 non-fatal amputations declined over time, with the greatest number of injuries in 2005 (8,450) and the lowest in 2010 (5,260). The incidence rate in 2014 in the U.S. was 5/100,000 full-time workers. Nationally, the median number of days away from work for those with an amputation was 21 days in 2014. As might be expected, the overwhelming majority of amputations (96%) involved a finger. The industry with the largest number of amputations was production.
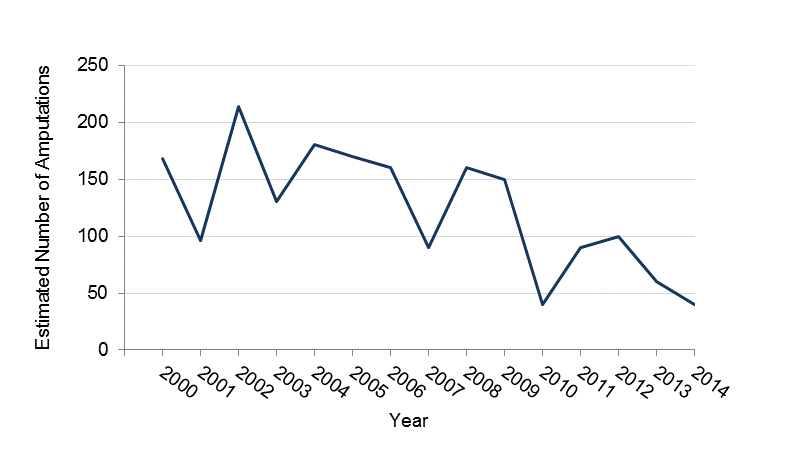
The number of reported amputations in Minnesota varies considerably from year to year. In 2009, 150 amputations were reported by employers while in 2010, 40 amputations were reported. The average number of reported cases during the period 2000-2014 was 123. The majority of amputations occurred in two broad industry classifications: installation, maintenance, and repair; and production. In 2014, the median number of days away from work was 7 in Minnesota. While it is well-recognized that SOII data may not be a complete count of amputations, these data provide an understanding of the rates and trends of amputations that occur each year.
These numbers of amputations estimated from a sample of employers can be compared to the numbers of amputations based on workers’ compensation claims. While there is relatively little year-to-year correlation in the numbers (up to a two-fold difference in counts), the average number of cases per year over the period 2000-2014 for each of the amputation indicators is quite similar: 135 cases based on workers’ compensation claims versus 123 cases per year as estimated by the SOII.
Number and Rate of Work Related Amputations Reported by Private Sector Employers in Minnesota, 2000-2014
| Year | Number | Rate per 100,000 Full Time Workers |
| 2000 | 168 | 9 |
| 2001 | 96 | 5 |
| 2002 | 214 | 12 |
| 2003 | 130 | 7 |
| 2004 | 180 | 11 |
| 2005 | 170 | 9 |
| 2006 | 160 | 9 |
| 2007 | 90 | 5 |
| 2008 | 160 | 9 |
| 2009 | 150 | 8 |
| 2010 | 40 | 2 |
| 2011 | 90 | 5 |
| 2012 | 100 | 6 |
| 2013 | 60 | 3 |
| 2014 | 40 | 2 |
Number of Work Related Amputations Involving Days Away from Work Reported by Employers in Minnesota, 2000-2014
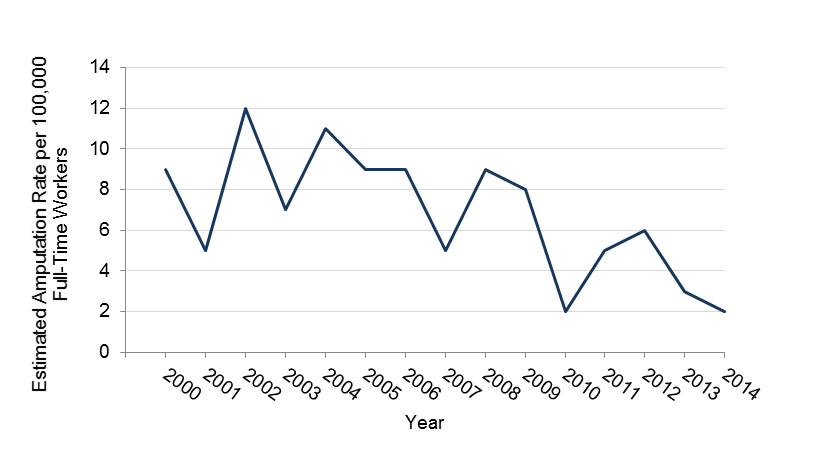
Incidence Rate of Amputations Involving Days Away From Work Reported by Employers per 100,000 Full Time Workers in Minnesota, 2000-2014
Trend analysis of both amputation indicators demonstrates a significant decreasing trend between 2000 and 2014. As this indicator is based on a sample of industries using employer-provided records, an undercount in the number of amputations is very likely. Even though this indicator may not be a complete count of amputations, it does provide an understanding of the rates and trends of amputations that occur each year and the continued need for both surveillance and intervention programs to further reduce work-related amputations.