Occupational Lead Exposure in Adults
The majority of cases of elevated blood lead levels (BLL) among adults are related to a workplace or hobby exposure. Elevated blood lead may cause damage to the nervous, hematologic, reproductive, renal, cardiovascular, or gastrointestinal systems.
Symptoms of lead poisoning
Some early symptoms of lead poisoning may include:
- fatigue, upset stomach or stomach cramps
- poor appetite
- irritability
- nervousness or depression
- headache
- sleeplessness
- metallic taste in the mouth,
- reproductive problems
- high blood pressure
- lack of concentration
- muscle and/or joint pain
Because of these detrimental health effects, the Federal and Minnesota Occupational Safety and Health Administration (OSHA) lead standards (1910.1025) require, among many other items, monitoring of blood lead levels in adults who are exposed to airborne lead concentrations that exceed certain thresholds.
Adult exposure to lead primarily happens at work in the workplace. Jobs with continued risk for lead exposure include battery manufacturing and recycling operations, smelting operations, and other manufacturing that utilizes lead based components. As industries have begun to remove lead from the manufacturing process, re-engineered the manufacturing process to reduce exposure, and provided employees with personal protective equipment, levels have come down over time. However, further efforts are warranted to prevent and reduce workplace exposures to lead.
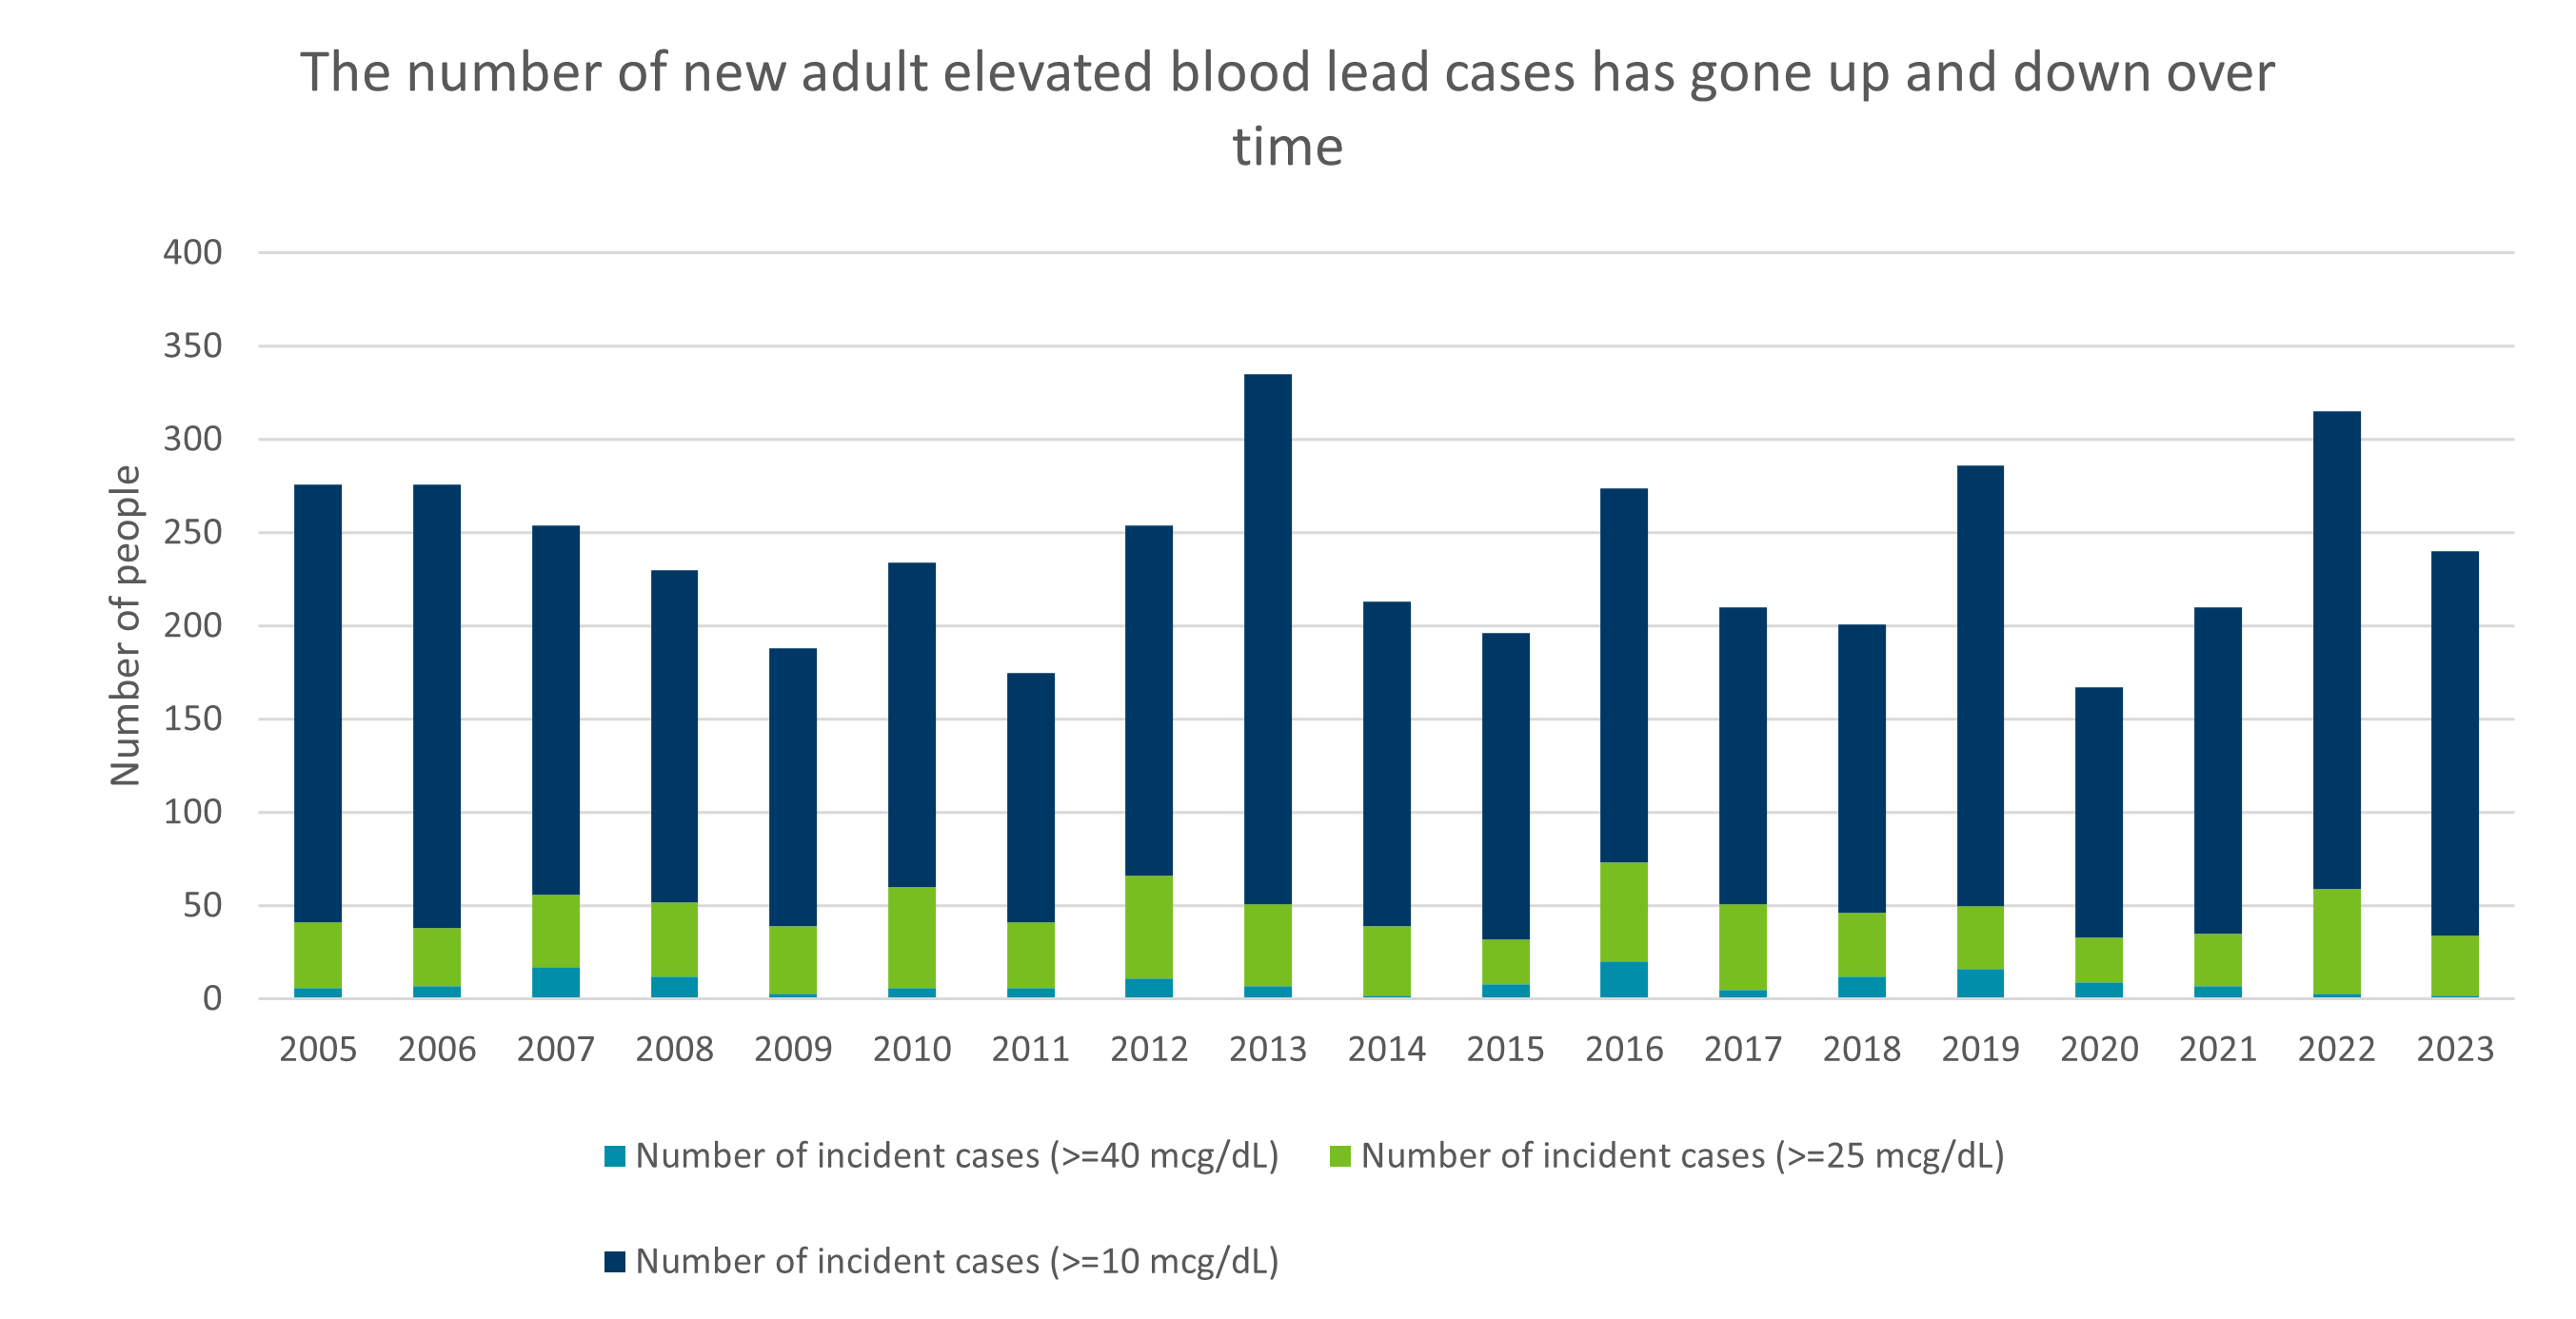
The number of new adult elevated blood lead cases has gone up and down over time

ucg/dL = micrograms of lead per deciliter of blood
Data measure: Incident cases are defined as adults with new elevated blood lead levels in the calendar year.
Data source: MDH Blood Lead Information System and Adult Blood Lead Epidemiology and Surveillance Program
Incident Adult Elevated Blood Lead Levels:
Mcg/dL = micrograms of lead per deciliter of blood. All blood lead test results are reported to MDH through the Blood Lead Information System. Data on adults are compiled through the Adult Blood Lead Epidemiology and Surveillance (ABLES) program. Incident cases are defined as adults with new elevated blood lead levels in the calendar year. Since 2005, the number of new elevated blood lead cases in adults has moved up and down, but has not shown a general trend higher or lower.
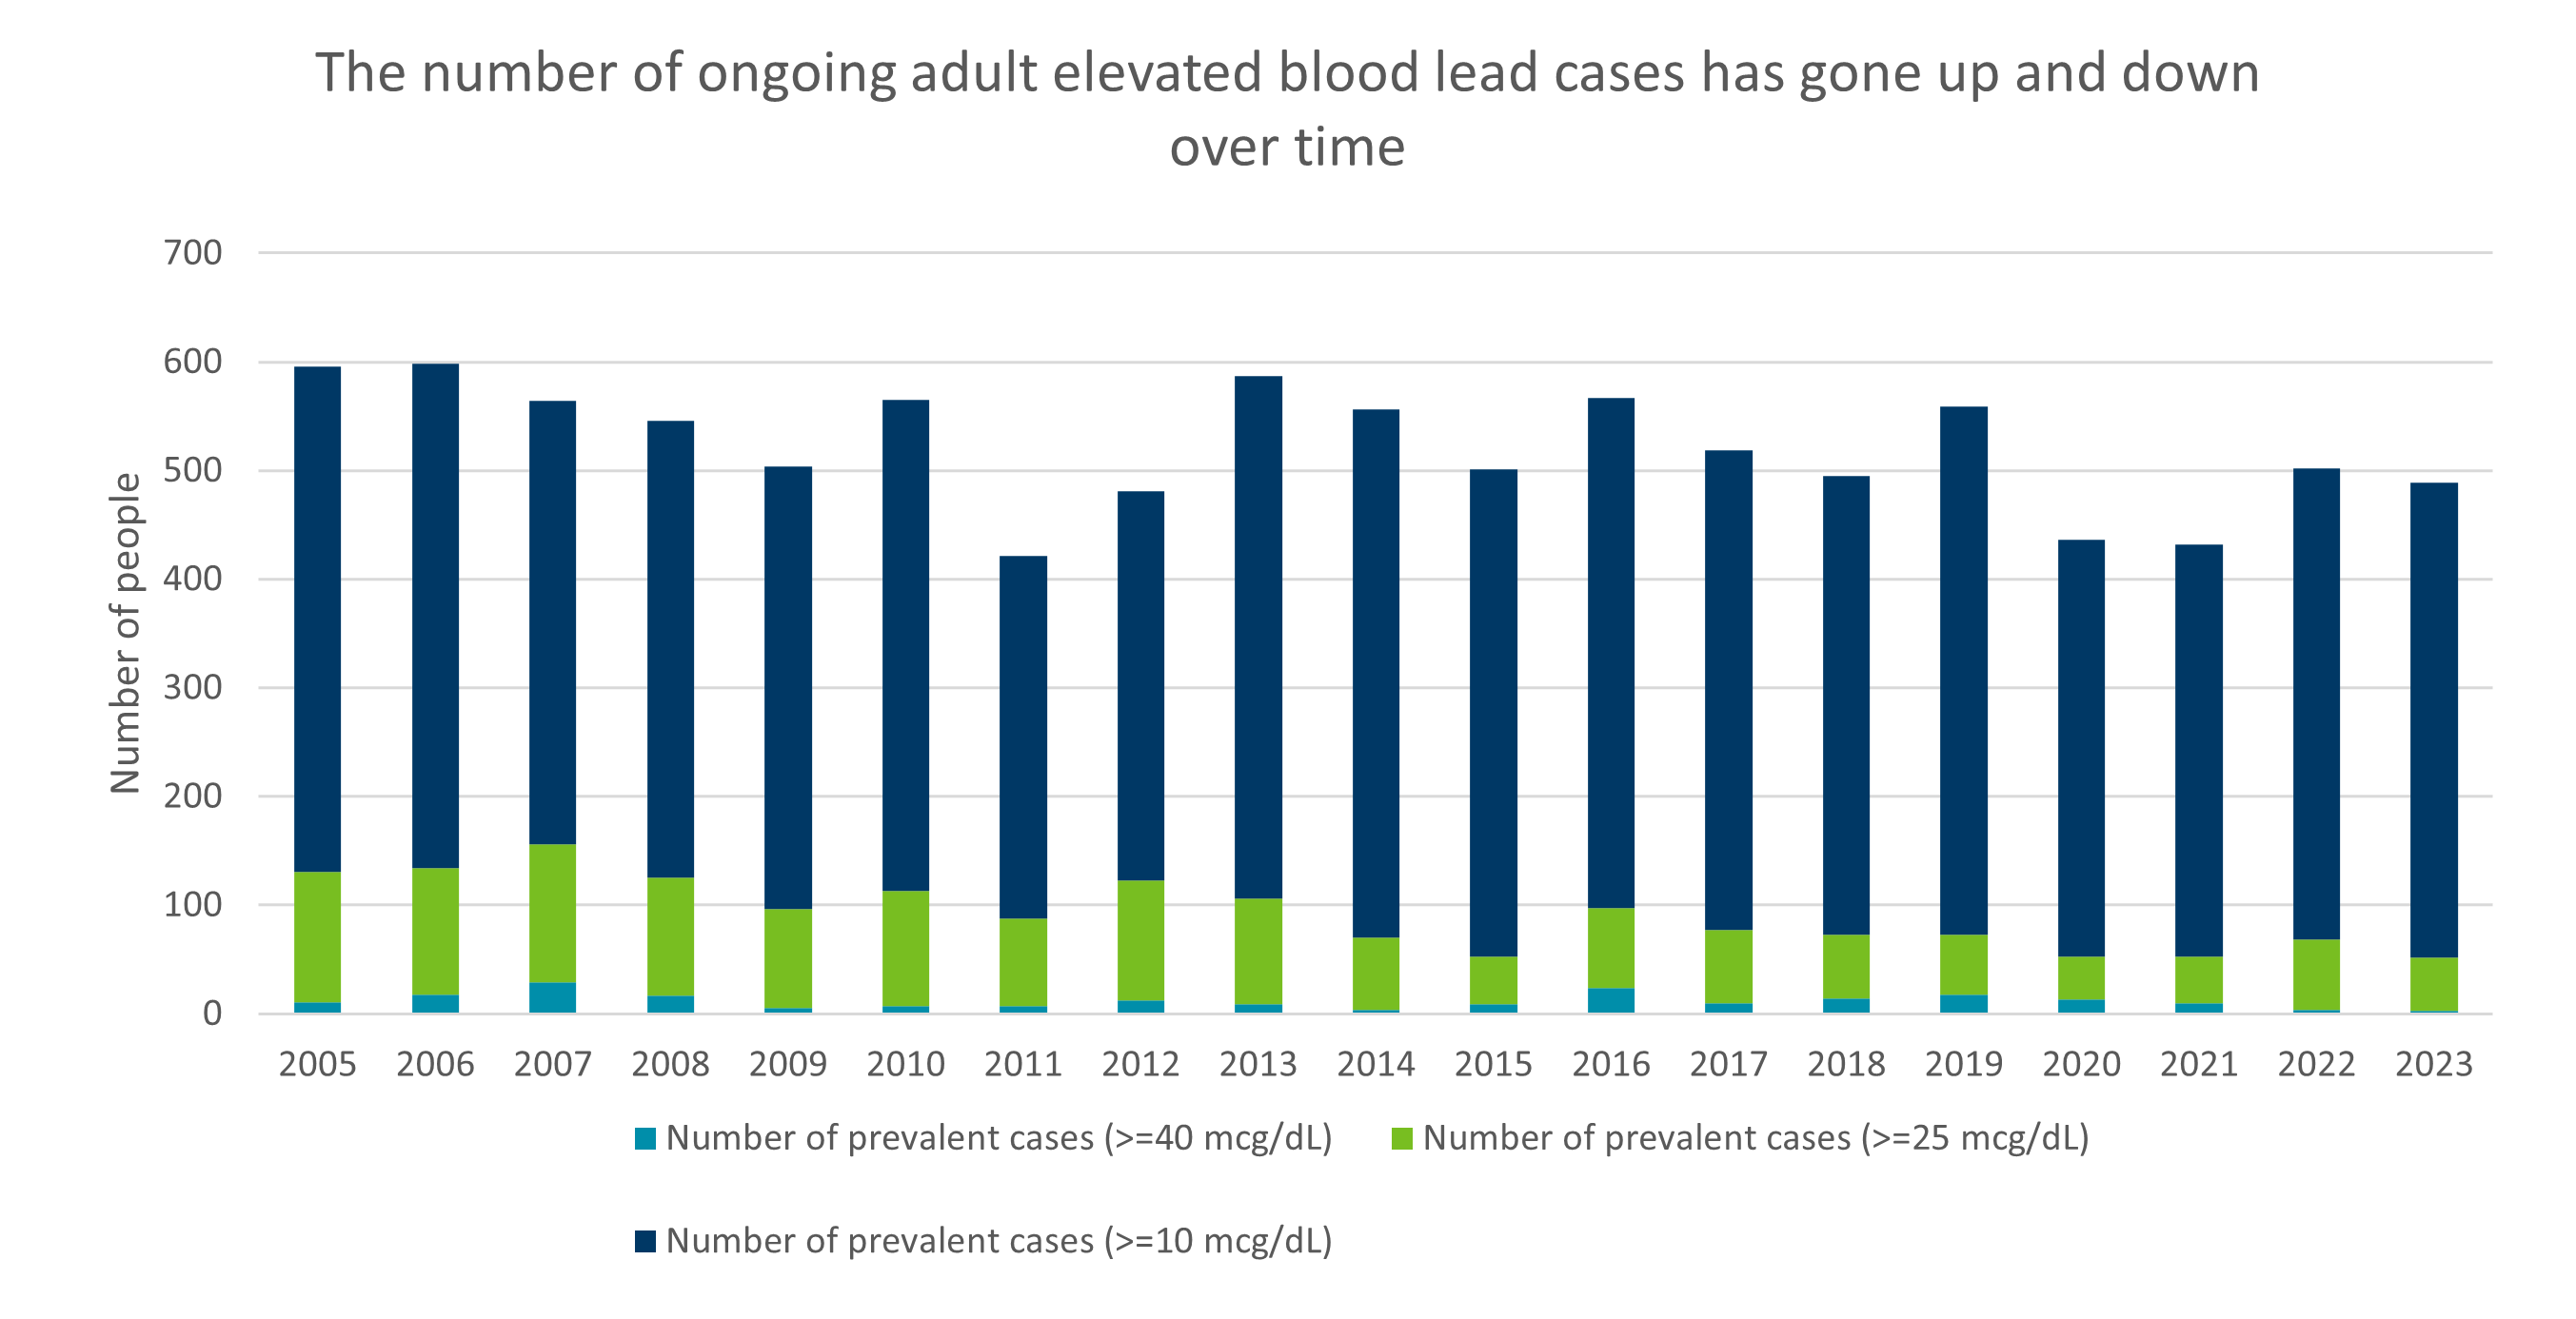
The number of ongoing adult elevated blood lead cases has gone up and down over time

Data measure: Prevalent cases are defined as adults with elevated blood lead levels in the calendar year.
They may be ongoing cases from previous years. ucg/dL = micrograms of lead per deciliter of blood.
Data source: MDH Blood Lead Information System and Adult Blood Lead Epidemiology and Surveillance Program
Prevalent adult elevated blood lead levels:
Mcg/dL = micrograms of lead per deciliter of blood. All blood lead test results are reported to MDH through the Blood Lead Information System. Data on adults are compiled through the Adult Blood Lead Epidemiology and Surveillance (ABLES) program. Prevalent cases are defined as adults with any elevated blood lead levels in the calendar year. The cases may be ongoing from previous years. Since 2005, the number of existing elevated blood lead cases in adults has moved up and down, but has not shown a general trend higher or lower.
The National Institute for Occupational Safety and Health (NIOSH) supports surveillance of adult blood levels through the Adult Blood Lead Epidemiology and Surveillance (ABLES) program.
This indicator utilizes data collected by the MDH Lead Program and provided to the MDH Center for Occupational Health and Safety. Minnesota Statute 144.9502 requires all health care providers and laboratories to report blood lead levels for both adults and children to the Minnesota Department of Health (MDH). The Lead Program collects the Minnesota blood lead test results and other reportable data. The childhood lead program addresses concerns related to elevated blood lead levels in children, and the MDH adult lead ABLES program address concerns for individuals over the age of 18 who have elevated blood lead levels.
Occupational lead exposure is of concern both for the worker and the worker’s family living in the same household. Similar to other occupational exposures, lead dust can be carried home on clothes, shoes, skin, and hair which can then be ingested by other members of the family. Lead poisoning in young children or a developing fetus may cause learning, behavior, and health problems; or possibly miscarriages, premature births, and stillbirths in pregnant women. Information on how to prevent bringing lead home can be found at the MDH Environmental Health Division’s lead webpage.
The lead indicator is based on a number of different blood lead levels reflecting various levels of concern and/or regulatory standards. As adverse health effects are believed to occur at very low levels, the lowest level of concern identified by the indicator is at 10 µg/dL. The U.S. Department of Health and Human Services recommends that adult blood levels be less than 25 µg/dL, which is the second level for this indicator. The third and highest threshold level is 40 µg/dL, which represents the highest blood lead level allowable by OSHA standards.
