Minnesota Employment Demographics
Minnesota’s occupational health and safety indicators are tools used to track worker health and safety, helping guide and evaluate programs, set priorities, and support decisions about funding and resources.
This demographic indicator describes various aspects of Minnesota’s employed population.
Demographics indicators
Hours worked
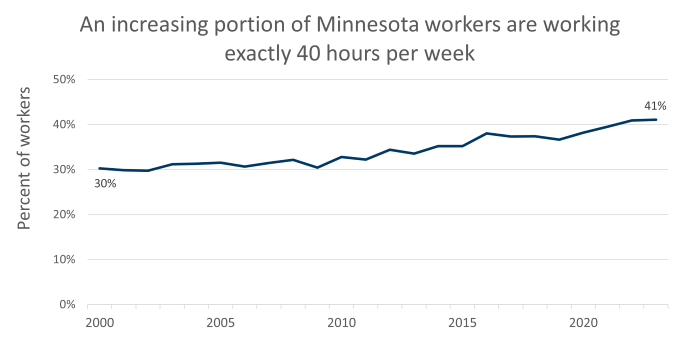
Source: Bureau of Labor Statistics Geographic Profile of Employment and Unemployment
The percent of Minnesota workers who work 40 hours has increased in recent years, at the same time that the percent of workers who work either more or less has decreased. Data are from the Bureau of Labor Statistics Geographic Profile of Employment and Unemployment, which summarizes findings from the Current Population Survey (CPS), an ongoing joint survey conducted by the Census Bureau and the Bureau of Labor Statistics.
Black and Hispanic workers
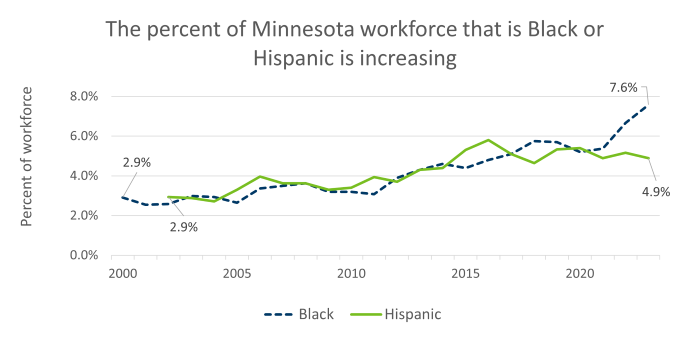
Source: Bureau of Labor Statistics Geographic Profile of Employment and Unemployment
The percent of Minnesota workers who are Black has increased from around 3% in the early 2000s to about 7.5% in 2023. The percent of workers who are Hispanic has increased from about 3% to about 5% during this same time period. The percent of workers who are White has decreased from about 95% to about 85%. Data are from the Bureau of Labor Statistics Geographic Profile of Employment and Unemployment, which summarizes findings from the Current Population Survey (CPS), an ongoing joint survey conducted by the Census Bureau and the Bureau of Labor Statistics.
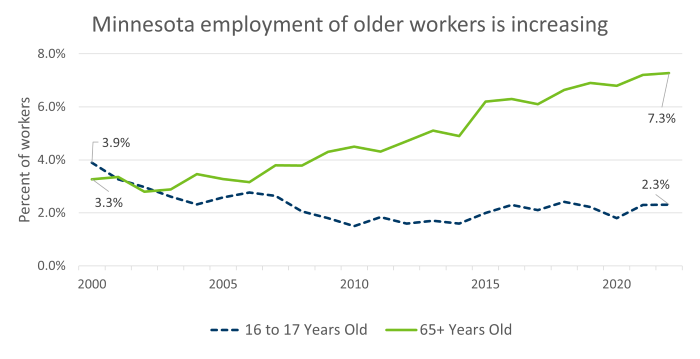
Employment by age
Source: NIOSH Employed Labor Force (ELF) Query System>Minnesota percent employment by sex, 2023
The percent of workers who are 16 to 17 years old decreased from 2000 to 2010, and has held steady since then. The percent of older workers, at least 65 years old, has increased from about 3% in 2000 to about 7% in 2023. Data are from the NIOSH Employed Labor Force query system, which summarizes findings from the Current Population Survey, an ongoing joint survey conducted by the Census Bureau and the Bureau of Labor Statistics. Current Population Survey (CPS).
Employment by sex
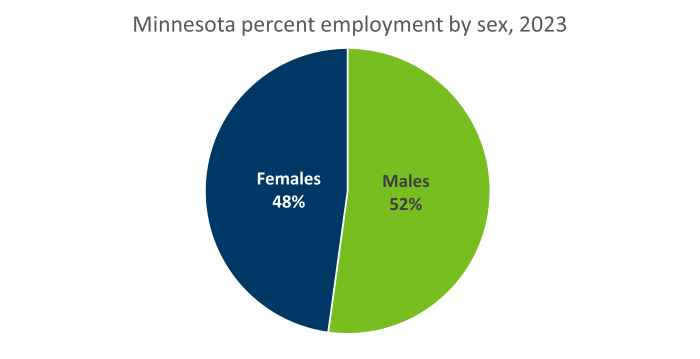
Percent Employment by Sex, 2023:
About 52% of Minnesota workers are male and 48% are female. These percentages have remained consistent since 2000. Data are from the Bureau of Labor Statistics Geographic Profile of Employment and Unemployment, which summarizes findings from the Current Population Survey (CPS), an ongoing joint survey conducted by the Census Bureau and the Bureau of Labor Statistics.
Employment by industry
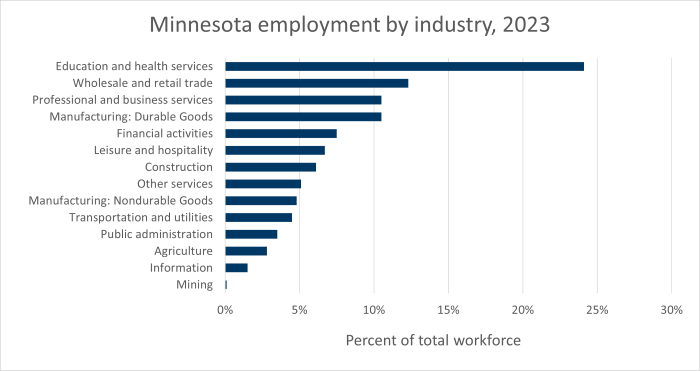
Source: Bureau of Labor Statistics Geographic Profile of Employment and Unemployment
Employment by Industry, 2023:
Minnesota has a diversified economy with workers employed in a wide range of industries. Education and health services was the industry group with the greatest percent of Minnesota workers in 2023, at about 24%. Data are from the Bureau of Labor Statistics Geographic Profile of Employment and Unemployment, which summarizes findings from the Current Population Survey (CPS), an ongoing joint survey conducted by the Census Bureau and the Bureau of Labor Statistics.
Employment by occupation
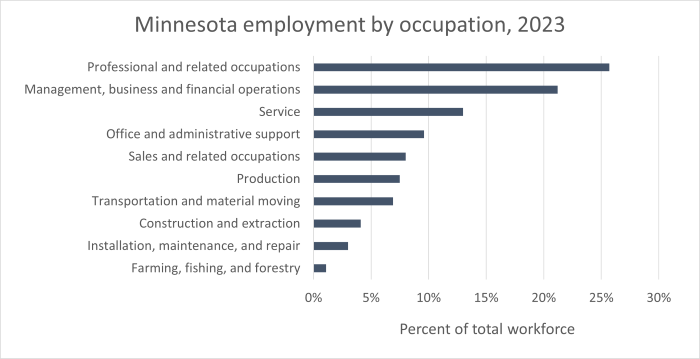
Source: Bureau of Labor Statistics Geographic Profile of Employment and Unemployment
Employment by Occupation, 2023:
Professional and related occupations and Management, business and financial operations were the highest two occupation groups represented by Minnesota workers in 2023. Data are from the Bureau of Labor Statistics Geographic Profile of Employment and Unemployment, which summarizes findings from the Current Population Survey (CPS), an ongoing joint survey conducted by the Census Bureau and the Bureau of Labor Statistics.
Self-employed and unemployed over time
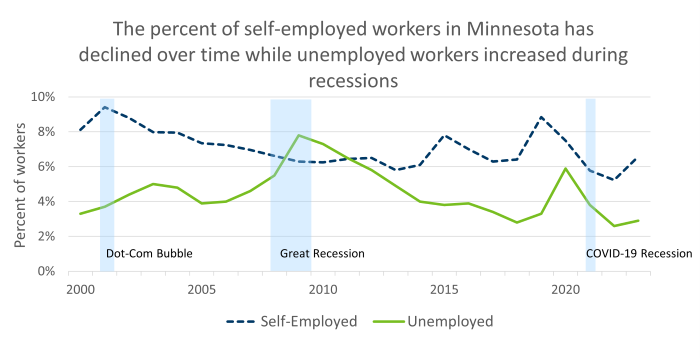
Source: Bureau of Labor Statistics Geographic Profile of Employment and Unemployment
Self-Employed/Unemployed:
The percent of Minnesota workers who are self-employed showed spikes in 2015 and 2019, but has otherwise generally declined since 2000. The percentage who are unemployed has shown spikes during the Great Recession and early COVID period, but has otherwise been around 3-4%. Data are from the Bureau of Labor Statistics Geographic Profile of Employment and Unemployment, which summarizes findings from the Current Population Survey (CPS), an ongoing joint survey conducted by the Census Bureau and the Bureau of Labor Statistics.