Work-related Low Back Disorders Requiring Hospitalization
Each year 15-20% of Americans report back pain, resulting in over 100 million workdays lost and more than 10 million physician visits. Strong epidemiological evidence exists for the correlation between workplace risk factors and low back disorders. NIOSH has summarized this research on the NIOSH topic page, Ergonomics and Musculoskeletal Disorders. These disorders are costly: an estimated $19.8 billion of lost work time for the nation in the year 2003 due to low back disorders. While these disorders are not limited to a single profession and may occur through a variety of exposures or activities, industry groups commonly affected include construction, retail, and administrative or office workers. In 2003, 3.2% of the U.S. workforce experienced a loss in work time (approximately 5 hours/week) due to back pain. These disorders have a substantial impact on the U.S. workforce, representing approximately 20% of all workers’ compensation claims but nearly 40% of the costs (Stewart et al, 2003).
The Minnesota hospital discharge dataset was used to create this indicator. The dataset is maintained by the Minnesota Hospital Association. The Minnesota hospital discharge dataset captures injury and illness events in Minnesota that require inpatient hospitalization. The case is then coded to describe the reason for hospitalization, or diagnosis, as well as all the care provided, or procedural codes. This indicator uses a number of these diagnostic and procedural codes to identify hospitalization events related to care for low back disorders. These codes identify cases within the Minnesota hospital discharge dataset as those receiving care for low-back disorders. The cases are then divided into two groups: those that required surgery and those that did not. A payer code of workers’ compensation is then used to identify the cases that are work-related. This indicator will not capture every case of low back pain caused by work as not every case will require inpatient hospitalization. Individuals seen in an outpatient setting or receiving care not covered by workers’ compensation will not be counted.
Trend analysis of the number of hospitalizations for low back pain related to work between 2000 and 2014 demonstrates a statistically significant decline over the years. This decline may be due to a number of factors including: changes in pain management and treatment, movement from the inpatient to outpatient setting, and improved identification of at risk workplace behaviors and exposures. These changes may explain the reduction seen in the number of work-related low back disorders identified for this indicator. One should be cautious when interpreting this indicator, as the Minnesota hospital discharge dataset is not a census of all work-related injury and changes in billing and coding practices as well as treatment practices could influence the number of identified cases.
Annual Number of Work-Related Low Back Pain Disorder Hospitalizations (Persons age 16 years or older), 2000 - 2014
| Year | Surgical Hospitalizations | Non-Surgical Hospitalizations |
|---|---|---|
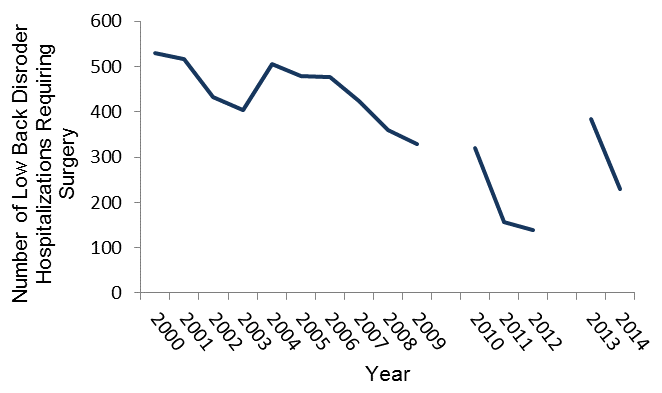
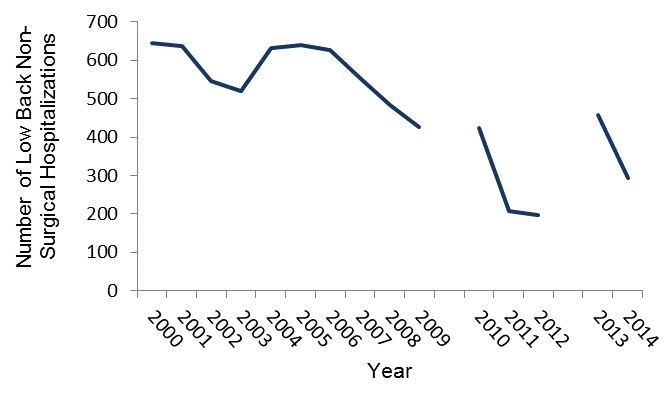
| 2000 | 530 | 646 |
| 2001 | 517 | 637 |
| 2002 | 432 | 547 |
| 2003 | 404 | 519 |
| 2004 | 506 | 633 |
| 2005 | 479 | 639 |
| 2006 | 476 | 626 |
| 2007 | 423 | 553 |
| 2008 | 360 | 483 |
| 2009 | 329 | 426 |
| 2010 | 320 | 424 |
| 2011 | 157 | 208 |
| 2012 | 139 | 196 |
| 2013 | 383 | 457 |
| 2014 | 230 | 293 |
Annual Number of Work-Related Low Back Pain Disorder Hospitalizations Requiring Surgery (Persons age 16 years or older), 2000 - 2014
Annual Number of Non-Surgical Hospitalizations for Work-Related Low Back Pain Disorder (Persons Age 16 years or older), 2000 – 2014
Annual Crude Rate of Hospitalizations for Low Back Pain Disorder Hospitalizations per 100,000 Employed Persons (Persons Age 16 years or older), 2000 – 2014
| Year | Surgical Hospitalization Rate | Non-Surgical Hospitalization Rate |
|---|---|---|
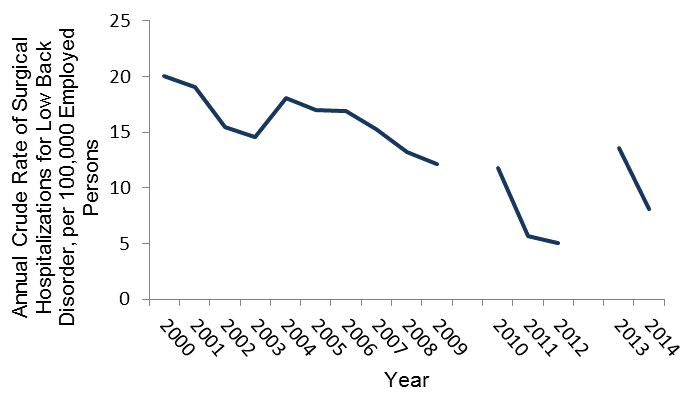
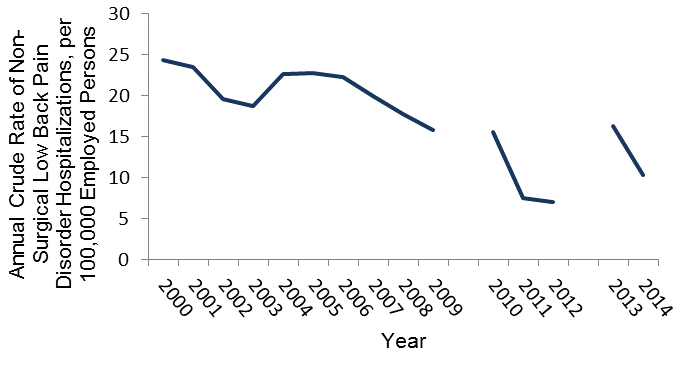
| 2000 | 20.0 | 24.4 |
| 2001 | 19.0 | 23.5 |
| 2002 | 15.5 | 19.6 |
| 2003 | 14.5 | 18.7 |
| 2004 | 18.1 | 22.6 |
| 2005 | 17.0 | 22.7 |
| 2006 | 16.9 | 22.2 |
| 2007 | 15.3 | 19.9 |
| 2008 | 13.2 | 17.7 |
| 2009 | 12.2 | 15.8 |
| 2010 | 11.8 | 15.6 |
| 2011 | 5.7 | 7.5 |
| 2012 | 5.0 | 7.0 |
| 2013 | 13.6 | 16.2 |
| 2014 | 8.1 | 10.3 |
Annual Crude Rate of Hospitalizations for Low Back Pain Disorder Hospitalizations Requiring Surgery per 100,000 Employed Persons (Persons Age 16 years or older), 2000 – 2014
Annual Crude Rate of Hospitalizations for Non-Surgical Low Back Pain Disorder Hospitalizations per 100,000 Employed Persons (Persons Age 16 years or older), 2000 – 2014
When interpreting this indicator one must be aware of several issues. Coding discrepancies in the years 2010, 2011, and 2012 by a number of hospitals created an undercount in the data. The breaks in the data denote these differences in coding practices, and trend analysis should be completed with caution. Due to the differences in provider recognition and payment mechanisms, there will be an undercount in the number of work-related injuries and illnesses identified in hospitalization billing data.