The Percentage of Workers Employed in Industries at High Risk for Occupational Morbidity
Rates of occupational injuries and illness vary greatly by both occupation and industry. This indicator focuses on the proportion of workers that are employed in industries at higher risk for injuries and illnesses. For this indicator, “high risk” industries are defined as those U.S. industries with a total recordable injury/illness rate that is at least twice the overall rate for all private sector industries. Since the overall injury rate has shown significant declines over the past decade, the actual rate considered “high risk” is modified every five years.
Two data sources are used to create this indicator: data indicating industries with high rates of injuries and illnesses; and the number of workers employed in those industries in Minnesota. The number of workers employed in specific industries is derived from the U.S. Census Bureau’s County Business Patterns Survey. The County Business Patterns Survey makes use of payroll data collected from randomly sampled businesses in mid-March. The information collected from the payroll data is then used to estimate the number of individuals employed in a specific industry or occupation.
State and national data on rates of occupational injuries and illnesses are derived from the annual Survey of Occupational Injuries and Illnesses (SOII) conducted by the Bureau of Labor Statistics (BLS) in collaboration with the states. The SOII collects data on non-fatal injuries and illnesses for each calendar year from a sample of employers. However, SOII does not include small farms, federal employees, self-employed, and household workers. The employers are required to provide information on injury or illness cases that result in one or more lost workdays, restricted work activity, job transfer, loss of consciousness, or require medical treatment (other than first aid). National and state data are available from the BLS web site. In Minnesota, the Department of Labor and Industry (DLI) compiles these cases and reports on an annual basis and the data are presented in great detail in DLI’s annual Minnesota Workplace Safety Report.
Industries that have at least twice the national rate of total reportable injuries and illnesses are classified as high risk. As the overall injury and illness rate has declined, the threshold rate for defining a high risk industry (at least twice the overall rate) has also declined. For the time frame shown for this indicator, different threshold rates were used for defining a high risk industry. For the time period 2000-2002, an injury and illness incidence rate of 13 cases per 100 full-time-equivalent workers or greater was used (representing 64 types of industries). For the period 2003-2007, an injury and illness incidence rate of 10 cases per 100 full-time-equivalent workers or greater was used (representing 37 industries). For the period 2008-2011, an injury and illness incidence rate of 7.8 cases per 100 full-time workers or greater was used (representing 55 industries). For the period 2012-2014 an injury and illness incidence rate of 6.4 cases per 100 full-time workers or greater was used (representing 54 industries).
The percentages of workers in high risk industries in Minnesota are shown in the graph and table below. High risk industries for the most recent time period (2012-2014) are also shown in the table below.
Percentage of Workers Employed in High Risk Morbidity Industries in Minnesota, 2000-2014
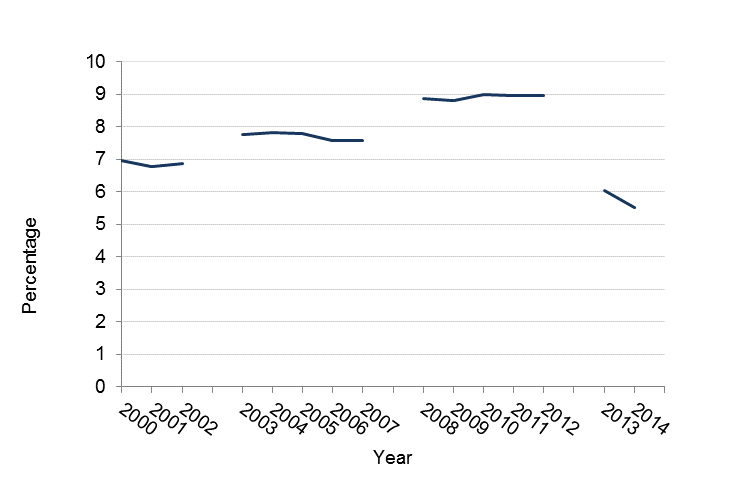
Percentage of Minnesota Workers in High Risk of Morbidity Industries, 2000-2014
| Year | Percentage |
| 2000 | 6.9 |
| 2001 | 6.8 |
| 2002 | 6.9 |
| 2003 | 7.8 |
| 2004 | 7.8 |
| 2005 | 7.8 |
| 2006 | 7.6 |
| 2007 | 7.6 |
| 2008 | 8.9 |
| 2009 | 8.7 |
| 2010 | 8.9 |
| 2011 | 8.9 |
| 2012 | 8.9 |
| 2013 | 6.0 |
| 2014 | 5.5 |
High Risk Industries for Occupational Morbidity, 2012-2014
| Industry |
| Rice Milling |
| Beet Sugar Manufacturing |
| Animal (except poultry) Slaughtering |
| Rendering and Meat Byproduct Processing |
| Soft Drink Manufacturing |
| Narrow Fabric Mills and Schiffli Machine Embroidery |
| Rope,Cordage, Twine, Tire Cord, and Tire Fabric Mills |
| Sawmills |
| Wood Preservation |
| Truss Manufacturing |
| Cut Stock, Resawing Lumber, and Planning |
| Other Millwork (including flooring) |
| Wood Container and Pallet Manufacturing |
| Manufactured Home (mobile home) Manufacturing |
| Prefabricated Wood Building Manufacturing |
| Rolling and Drawing of Purchased Steel |
| Plastics Pipe and Pipe Fitting Manufacturing |
| Other Concrete Product Manufacturing |
| Steel Wire Drawing |
| Iron Foundries |
| Steel Foundries (except investment) |
| Nonferrous Metal Die-Casting Foundries |
| Aluminum Foundries (except die-casting) |
| Other Nonferrous Metal Foundries (except die-casting) |
| Plate Work Manufacturing |
| Other Metal Container Manufacturing |
| Farm Machinery and Equipment Manufacturing |
| Automobile Manufacturing |
| Light Truck and Utility Vehicle Manufacturing |
| Truck Trailer Manufacturing |
| Travel Trailer and Camper Manufacturing |
| Motor Vehicle Metal Stamping |
| Ship Building and Repairing |
| Boat Building |
| Showcase, Partition, Shelving, and Locker Manufacturing |
| Burial Casket Manufacturing |
| Other Home Fursnishings Stores |
| Luggage and Leather Goods Stores |
| Pet and Pet Supplies Stores |
| Scheduled Passenger Air Transportation |
| Interurban and Rural Bus Transportation |
| Marine Cargo Handling |
| Couriers and Express Delivery Services |
| Veterinary Services |
| Solid Waste Collection |
| Other Nonhazardous Waste Treatment and Disposal |
| Material Recovery Facilities |
| Ambulance Services |
| Psychiatric and Substance Abuse Hospitals |
| Nursing Care Facilities (Skilled Nursing Facilities) |
| Continuing Care Retirement Communities and Assisted Living Facilities for the Elderly |
| Other Residential Care Facilities |
| Amusement and Theme Parks |
| Skiing Facilities |