Non-Fatal Work-Related Injuries and Illnesses Reported by Employers
This indicator tracks work-related injuries or illnesses that result in an employee having to take time away from work. Examples of work-related injuries include falls, burns, being struck or crushed, fractures, electric shocks, cuts, amputations, needle-sticks, and assaults. Examples of work-related illnesses include contact dermatitis, asthma, some types of cancer, asbestosis, carpal-tunnel syndrome, frostbite, and hearing loss. Injuries and illnesses prevent an employee from participating in normal activities and adversely impact the employee, the employee’s family, and the employer. Work related injuries and illnesses are preventable with proper training and control of occupational hazards.
State and national data on occupational injuries and illnesses are derived from the annual Survey of Occupational Injuries and Illnesses (SOII) conducted by the Bureau of Labor Statistics (BLS) in collaboration with the states. The SOII collects data on non-fatal injuries and illnesses for each calendar year from a sample of employers. However, SOII does not include small farms, federal employees, self-employed, and household workers. The employers are required to provide information on injury or illness cases that result in one or more lost workdays, restricted work activity, job transfer, loss of consciousness, or require medical treatment (other than first aid). National and state data are available from the BLS web site. In Minnesota, the Department of Labor and Industry (DLI) compiles these cases and reports on an annual basis and the data are presented in great detail in DLI’s annual Minnesota Workplace Safety Report.
Nationally in 2012, the BLS reported an estimated total of injury and illness cases requiring days away from work within the private sector workforce, with an estimated annual incidence rate of 3.4 cases per 100 full-time-equivalent (FTE) workers. More than half of these cases involved missed days of work, job transfer or other restrictions. The private sector rate in Minnesota in 2012 was slightly higher than the national rate at 3.8 cases per 100 full-time workers. Rates for the public sector workforce (state and local government) were higher than for the private sector, both nationally and in Minnesota. The national public and private sector rate in 2012 was 3.7 cases per 100 full-time workers, while the rate in Minnesota was approximately 3.9 cases per 100 workers. Detailed characteristics of injury and illness rates by type and size of industry, occupation, type of injury or illness, and demographic characteristics are available from the Minnesota Workplace Safety Report by the Department of Labor and Industry.
The numbers, rates, and trends of occupational injury and illness in Minnesota from 2000 to 2014 are shown in the graphs and tables below. Of the 78,700 injuries and illnesses that occurred in Minnesota in 2014 (both public and private sector), almost 21,600 involved one or more days away from work. The data show a significantly declining trend in the numbers and rates of injuries and illnesses over the past 10 years. While the declining trend in injury and illness is encouraging, occupational injuries and illnesses still extract an enormous toll.
While SOII data provide the most widely used and detailed statistics on non-fatal occupational injuries and illnesses in the U.S, it is well-established that SOII undercounts injuries and illnesses due to a variety of factors (injury logs are not properly completed by companies, some industries and occupations are not included, the survey is a sample, and other factors). Even though this indicator may not be a complete count of injuries, it does provide an understanding of the magnitude of injuries that occur each year.
This indicator provides health and safety professionals with information about rates and trends of injuries and illnesses in the state of Minnesota. This information may be useful in identifying higher risk industries and occupations, setting priorities for prevention efforts, and evaluating effectiveness of intervention programs.
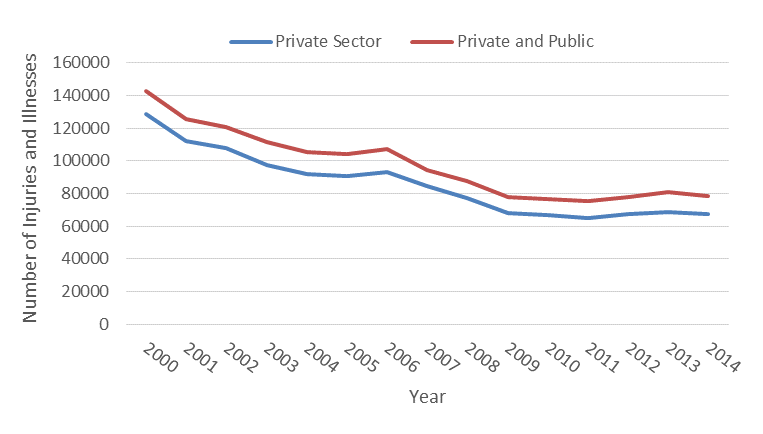
Total Number of Work-Related Injuries and Illnesses in Minnesota, 2000 – 2014
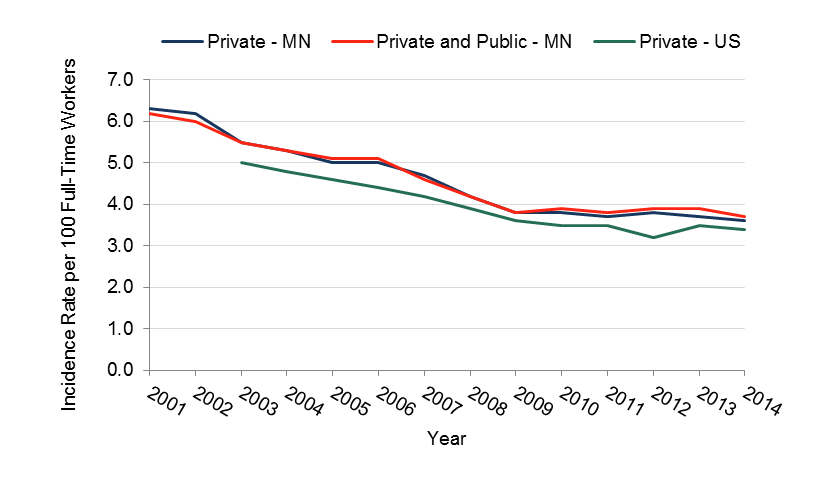
Total Work-Related Injury and Illness Incidence Rate per 100 Full-Time Workers in Minnesota and U.S., 2000 - 2014
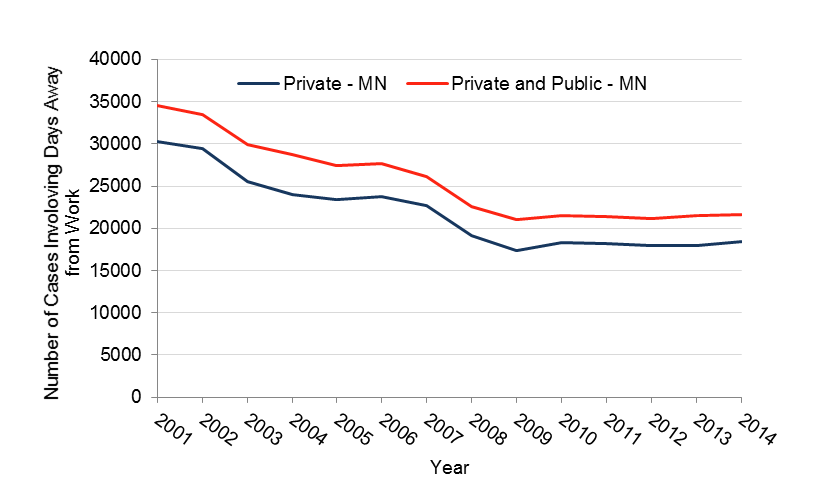
Total Number of Cases Involving Days Away From Work in Minnesota, 2000 – 2014
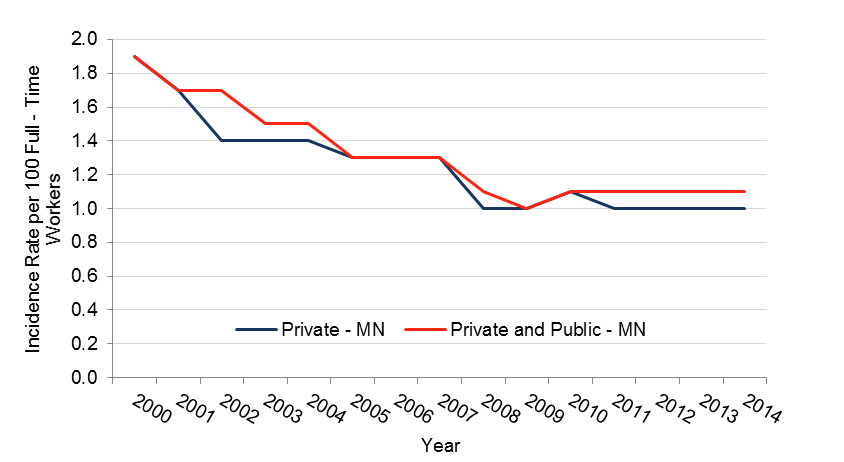
Incidence Rate for Cases Involving Days Away from Work per 100 Full Time Workers in Minnesota, 2000 – 2014
Total Number of Private Sector Cases Involving More Than 10 Days Away From Work in Minnesota, 2003 – 2014
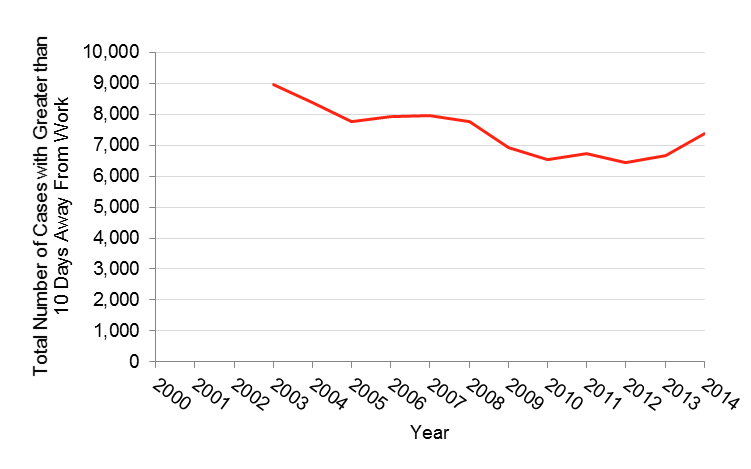
Table. Numbers and Rates of Private Sector and the Private and Public Sector Combined Occupational Injuries and Illnesses in Minnesota, 2000-2014
| Year | Number of Total Work-Related Injuries and Illnesses (thousands) (Private Sector) | Number of Total Work-Related Injuries and Illnesses (thousands) (Private and Public Sector) | Rate of Total Work-Related Injuries and Illnesses per 100 FTEs (Private Sector) | Rate of Total Work-Related Injuries and Illnesses per 100 FTEs (Private and Public Sector) |
| 2000 | 128.6 | 142.5 | 7.0 | 6.8 |
| 2001 | 112 | 125.8 | 6.3 | 6.2 |
| 2002 | 107.8 | 120.5 | 6.2 | 6.0 |
| 2003 | 97.7 | 111.6 | 5.5 | 5.5 |
| 2004 | 91.8 | 105.5 | 5.3 | 5.3 |
| 2005 | 90.6 | 104.1 | 5.0 | 5.1 |
| 2006 | 93.0 | 107.1 | 5.0 | 5.1 |
| 2007 | 84.8 | 94.2 | 4.7 | 4.6 |
| 2008 | 77.3 | 87.9 | 4.2 | 4.2 |
| 2009 | 67.8 | 78.1 | 3.8 | 3.8 |
| 2010 | 66.7 | 76.7 | 3.8 | 3.9 |
| 2011 | 64.7 | 75.4 | 3.7 | 3.8 |
| 2012 | 67.5 | 77.6 | 3.8 | 3.9 |
| 2013 | 68.5 | 81.2 | 3.7 | 3.9 |
| 2014 | 67.3 | 78.7 | 3.6 | 3.7 |
| Year | Number of Cases Involving Days Away From Work (thousands) (Private Sector) | Number of Cases Involving Days Away From Work (thousands) (Private and Public Sector) | Rate for Cases Involving Days Away From Work per 100 FTEs (Private Sector) | Rate for Cases Involving Days Away From Work per 100 FTEs (Private and Public Sector) | Number of Private Cases Involving More than 10 Days Away From Work (thousands) |
| 2000 | 34.9 | 39.2 | 1.9 | 1.9 | |
| 2001 | 30.3 | 34.5 | 1.7 | 1.7 | |
| 2002 | 29.4 | 33.5 | 1.4 | 1.7 | |
| 2003 | 25.6 | 29.9 | 1.4 | 1.5 | 8.97 |
| 2004 | 24.0 | 28.7 | 1.4 | 1.5 | 8.37 |
| 2005 | 23.4 | 27.4 | 1.3 | 1.3 | 7.75 |
| 2006 | 23.8 | 27.7 | 1.3 | 1.3 | 7.94 |
| 2007 | 22.7 | 26.1 | 1.3 | 1.3 | 7.95 |
| 2008 | 19.2 | 22.6 | 1.0 | 1.1 | 7.77 |
| 2009 | 17.4 | 21.0 | 1.0 | 1.0 | 6.91 |
| 2010 | 18.3 | 21.5 | 1.1 | 1.1 | 6.53 |
| 2011 | 18.2 | 21.4 | 1.0 | 1.1 | 6.72 |
| 2012 | 18.0 | 21.2 | 1.0 | 1.1 | 6.45 |
| 2013 | 18.0 | 21.5 | 1.0 | 1.1 | 6.68 |
| 2014 | 18.4 | 21.6 | 1.0 | 1.1 | 7.39 |