The Percentage of Workers Employed in Occupations at High Risk for Occupational Morbidity
Rates of occupational injuries and illness vary greatly by both occupation and industry. This indicator focuses on the proportion of workers in occupations at high risk for injury or illness (morbidity). For this indicator, “high risk” occupations are defined as those private sector occupations in the U.S. that have a two-fold or higher rate of injuries or illnesses involving one or more missed days of work. Since the overall injury rate has shown significant declines over the past decade, the actual rate considered “high risk” is modified every five years.
Two data sources are used to create this indicator: data showing occupations with a two-fold or higher injury and illness rate; and the number of workers employed in those occupations in Minnesota. The number of employees in each occupational category is derived from the Current Population Survey (CPS) conducted by the U.S. Census.
State and national data on rates occupational injuries and illnesses are derived from the annual Survey of Occupational Injuries and Illnesses (SOII) conducted by the Bureau of Labor Statistics (BLS) in collaboration with the states. The SOII collects data on non-fatal injuries and illnesses for each calendar year from a sample of employers. However, SOII does not include small farms, federal employees, self-employed, and household workers. The employers are required to provide information on injury or illness cases that result in one or more lost workdays, restricted work activity, job transfer, loss of consciousness, or require medical treatment (other than first aid). National and state data are available from the BLS website. In Minnesota, the Department of Labor and Industry (DLI) compiles these cases and reports on an annual basis and the data are presented in great detail in DLI’s annual Minnesota Workplace Safety Report.
Occupations that have at least twice the national rate of total reportable injuries and illnesses are classified as high risk. As the overall injury and illness rate has declined, the threshold rate for defining a high risk occupation (at least twice the overall rate) has also declined. For the time frame shown for this indicator, different threshold rates were used for defining a high risk occupation. For the time period 2000-2002, an occupation was identified as high risk if the occupation had an injury and illness rate greater than 5 cases per 100 full time employees (representing 23 occupations). For the time period 2003-2007, the high risk rate was defined as 2.6 cases per 100 full time employees (representing 82 occupations). For the period 2008-2011, the high risk rate was defined as 2.3 cases per 100 full time workers (representing 61 occupations). For the time period 2012-2014 the high risk rate was definted as 1.7 cases per 100 full time workers (representing 49 occupations).
The percentages of workers in high risk occupations in Minnesota are shown in the graph and table below. High risk occupations for the most recent time period (2012-2014) are also shown in the table below.
Due to coding changes and changing threshold rates over each time period, trend analysis was limited to the five-year period 2003-2007. No change was found in the percentage of Minnesotans employed in high risk occupations.
Percentage of Minnesotans Employed in High Morbidity Risk Occupations, 2000-2014
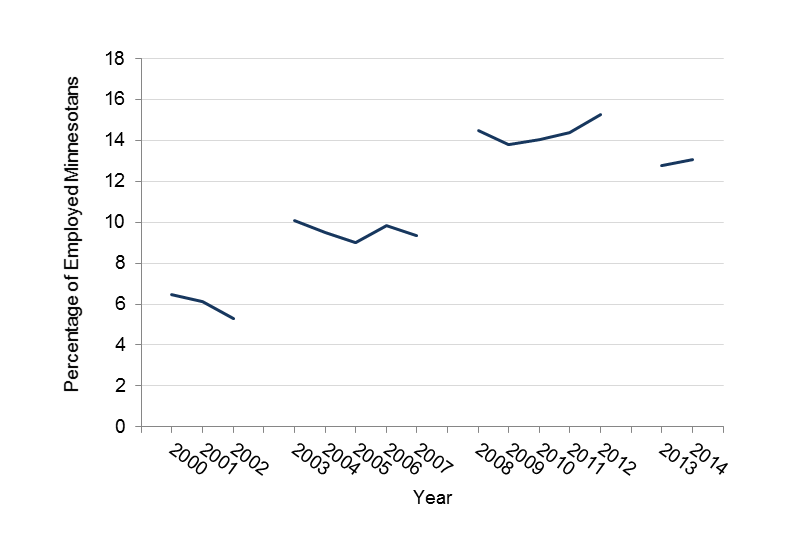
Percentage of Minnesotans Employed in High Morbidity Risk Occupations in Minnesota, 2000-2014
| Year | Percentage |
| 2000 | 6.5 |
| 2001 | 6.1 |
| 2002 | 5.3 |
| 2003 | 10.1 |
| 2004 | 9.5 |
| 2005 | 9.0 |
| 2006 | 9.8 |
| 2007 | 9.4 |
| 2008 | 14.5 |
| 2009 | 13.8 |
| 2010 | 14.1 |
| 2011 | 14.4 |
| 2012 | 15.3 |
| 2013 | 12.8 |
| 2014 | 13.1 |
The rate used in defining a high risk occupation was changed for each of the four time periods (2000–2002, 2003–2007, 2008–2011, 2012-2014), so comparisons should not be made between any of four periods.
High Risk Occupations for Occupational Morbidity, 2012-2014
| Occupations |
| Surveyors, Cartographers, and Photogrammetrists |
| Athletes, Coaches, Umpires, Ad related workers |
| Emergency Medical Technicians and Paramedics |
| Nursing, Psychiatric, and Home Health Aides |
| Veterinary Assistants and Laboratory Animal Caretakers |
| Police and Sherrif's Patrol Officers |
| Crossing Guards |
| Food Preparation Workers |
| First-line Supervisors of Landscaping, Lawn Service, and Grounds-keeping Workers |
| Janitors and Building Cleaners |
| Maids and Housekeeping Cleaners |
| Grounds Maintenance Workers |
| Non farm Animal Caretakers |
| Reservation and Transportation Ticket Agents and Travel Clerks |
| Cargo and Freight Agents |
| Logging Workers |
| Carpenters |
| Roofers |
| Structural Iron and Steel Workers |
| Septic Tank Servicers and Sewer Pipe Cleaners |
| Miscellaneous Construction and Related Workers |
| Earth Drillers, Except Oil and Gas |
| Mining Machine Operators |
| Radio and Telecommunications Equipment Installers and Repairers |
| Electric Motor, Power Tool, and Related Repairers |
| Electronic Home Entertainment Equipment Installers and Repairers |
| Automotive Service Technicians and Mechanics |
| Heavy Vehicle and Mobile Equipment Service Technicians and Mechanics |
| Miscellaneous Vehicle and Mobile Equipment Mechanics, Installers, and Repairers |
| Control and Valve Installers and Repairers |
| Heating, Air Conditioning, and Refrigeration Mechanics and Installers |
| Maintenance and Repair Workers, General |
| Telecommunications Line Installers and Repairers |
| Helpers-Installation, Maintenance, and Repair Workers |
| Part of Molders and Molding Machine Setters, Operators,and Tenders, Metal and Plastic |
| Furniture Finishers |
| Sawing Machine Setters, Operators, and Tenders, Wood |
| Photographic process workers, and processing machine operators |
| Tire Builders |
| Flight attendants |
| Bus Drivers |
| Drivers/Sales Workers and Truck Drivers |
| Taxi Drivers and Chauffeurs |
| Railroad Conductors and Yardmasters |
| Laborers and Freight, Stock,and Material Movers, Hand |
| Refuse and Recyclable Material Collectors |
The table above shows a list of occupations that had an injury rate at least twice the overall U.S. rate during 2012-2014.