Minnesota OSHA Enforcement Activities
The Minnesota Occupational Safety and Health (MNOSHA) program is administered by the Minnesota Department of Labor and Industry. The program was established by the Minnesota Occupational Safety and Health Act of 1973. In 1985 Minnesota was approved by Federal OSHA to conduct its own occupational safety and health program covering both private and public sectors. MNOSHA adopts federal OSHA standards by reference and develops state-specific standards when appropriate. MNOSHA’s Compliance Division is responsible for conducting enforcement inspections, adoption of health and safety standards, and other OSHA activities. The Workplace Safety Consultation Division provides free consultation services at the request of employers.
MNOSHA uses workers compensation data and other special emphasis programs to prioritize specific industries and occupations to be inspected in a calendar year. Other priorities for inspection include: reports of imminent danger; complaints from employees or the general public; a fatality occurs at a worksite; 3 or more employees are hospitalized; referrals from other government agencies; and follow up inspections to ensure previously identified violations have been corrected.
This indicator uses records kept by MN OSHA detailing their inspection and enforcement activities. However, because MNOSHA may conduct follow up inspections of a single facility, this may lead to an over-estimation by the indicator of the number of establishments or employees covered by the inspections.
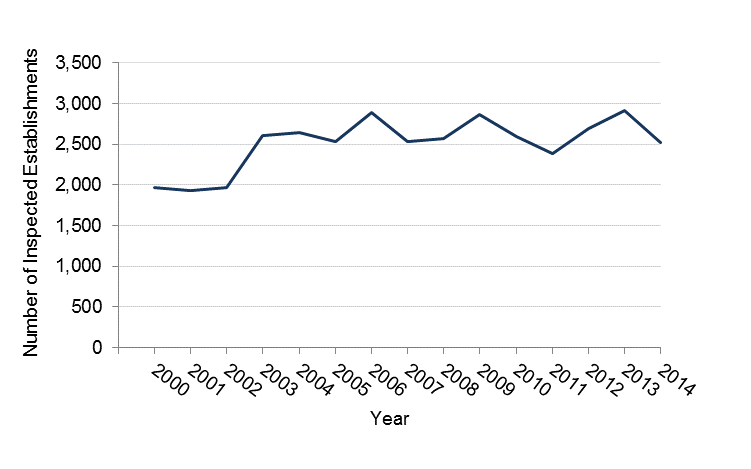
Number of Establishments Inspected by MNOSHA, 2000-2014
| Year | Number of Establishments | Percentage of Establishments |
| 2000 | 1,966 | 1.3 |
| 2001 | 1,928 | 1.3 |
| 2002 | 1,969 | 1.3 |
| 2003 | 2,608 | 1.7 |
| 2004 | 2,647 | 1.7 |
| 2005 | 2,530 | 1.6 |
| 2006 | 2,885 | 1.7 |
| 2007 | 2,537 | 1.5 |
| 2008 | 2,569 | 1.5 |
| 2009 | 2863 | 1.8 |
| 2010 | 2592 | 1.6 |
| 2011 | 2388 | 1.5 |
| 2012 | 2,698 | 1.6 |
| 2013 | 2,912 | 1.8 |
| 2014 | 2,522 | 1.6 |
Number of Establishments Inspected by MNOSHA

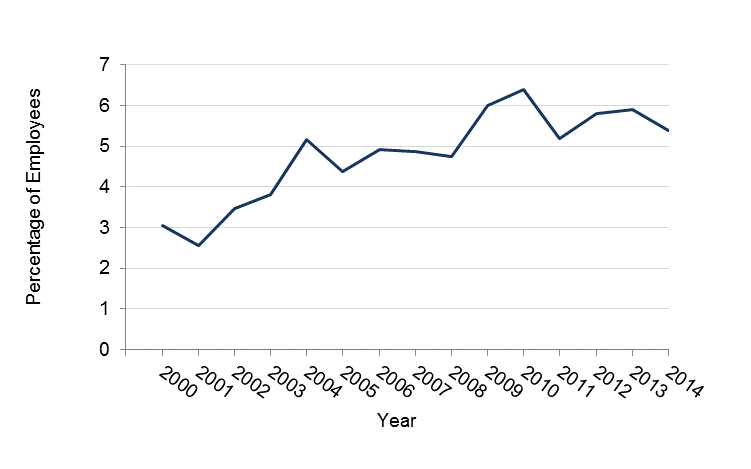
Percentage of Employees with a Work-Area Inspected by MNOSHA, 2000-2014
| Year | Number of Employees | Percentage of Employees |
| 2000 | 79,298 | 3.1 |
| 2001 | 66,362 | 2.6 |
| 2002 | 89,367 | 3.5 |
| 2003 | 97,582 | 3.8 |
| 2004 | 133,185 | 5.2 |
| 2005 | 114,741 | 4.4 |
| 2006 | 130,295 | 4.9 |
| 2007 | 129,723 | 4.9 |
| 2008 | 125,978 | 4.7 |
| 2009 | 153,034 | 6.0 |
| 2010 | 162,117 | 6.4 |
| 2011 | 133,257 | 5.2 |
| 2012 | 152,752 | 5.8 |
| 2013 | 159,540 | 5.9 |
| 2014 | 145,808 | 5.4 |
Percentage of Employees Who’s Work-Area Was Inspected by MNOSHA, 2000-2014

Trend analysis indicated a statistically significant increase in the number of covered establishments and employees that were inspected by MNOSHA from 2000 through 2014. The increase in inspections may improve compliance with occupational health and safety regulations, providing a safer work environment for Minnesota’s workers.
To learn more about Minnesota OSHA inspection program and other programs they are actively involved in, visit MNOSHA's Safety and Health at Work program.