Hospitalizations From or With Pneumoconiosis
There are two Occupational Health Indicators for pneumoconiosis: times when people were admitted to a hospital or died from pneumoconiosis. The indicator shown here is for the number of people admitted to a hospital. Discharge data from the Minnesota Hospital Association is used to create this indicator. The Minnesota Hospital Association provides de-identified administrative billing data that can be used to track the counts, rates, and trends of disease and injury in Minnesota.
Pneumoconiosis refers to a group of interstitial lung diseases that result from inhalation of dusts, particularly mineral or metal dusts. The distinction between each type of pneumoconiosis is dependent upon the type of dust the individual was exposed to. While there are many types of dusts and the types of lung diseases that they cause, the primary pneumoconioses are asbestosis, silicosis, and coal workers’ pneumoconiosis, caused respectively by asbestos fibers, silica, and coal dust. The dust exposure may lead to inflammation and damage of the lung tissue that cannot be repaired; eventually decreasing lung function. While the overwhelming majority of pneumoconiosis cases are due to occupational exposures, rare cases have been attributed to environmental exposures such as through contaminated work clothes brought into the home.
For purposes of medical surveillance and epidemiologic research, pneumoconioses are primarily identified through chest X-rays using international guidelines for taking and interpreting the chest radiographs. Pulmonary function tests are also typically utilized to measure the degree and pattern of breathing impairment. A work history of dust exposure is also an important part of identifying pneumoconioses.
Pneumoconioses tend to occur many years – often many decades – after the onset of exposure, typically well after the individual has changed jobs or has retired. As with other occupational illnesses that have long latency periods, only a small portion of pneumoconioses are identified and reported by employer-based reporting systems or workers’ compensation claims. As a result, data focused on the number of people admitted to the hospital and from death certificate are frequently used data sources for monitoring rates and trends of these diseases.
Pneumoconioses are debilitating diseases and may result in death. Development of pneumoconiosis puts an individual at increased risk of other respiratory infections or conditions, such as: chronic bronchitis, emphysema, lung cancer, pleuritis, and tuberculosis. Despite OSHA standards, reduced exposures, and increased recognition of the importance of personal respiratory protection, many workers remain at risk of dust-related lung disease and continuing surveillance of these diseases remains a critical need.
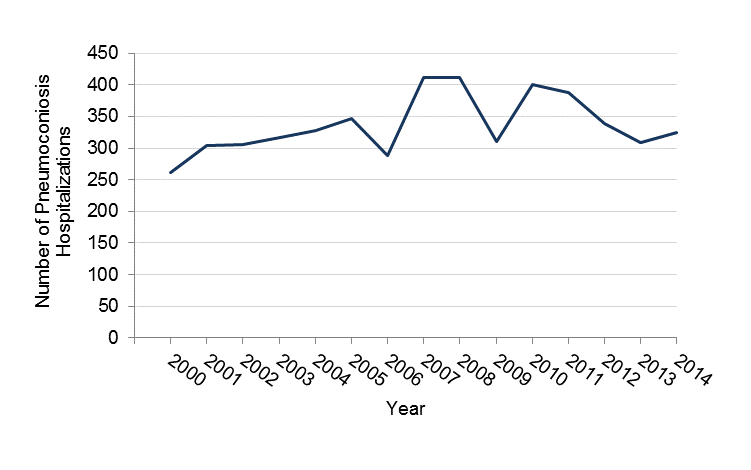
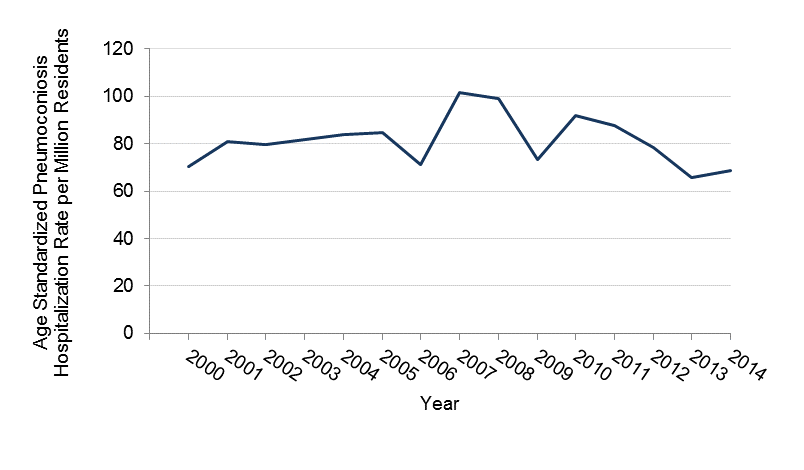
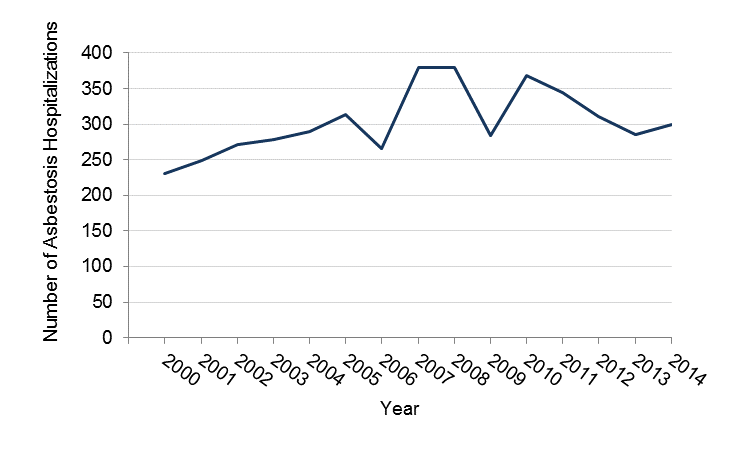
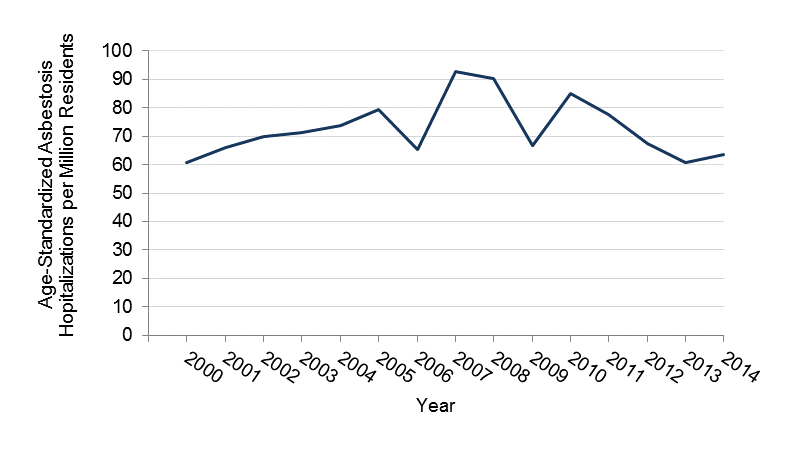
The tables and figures below show the annual numbers and rates of people admitted to a hospital with pneumoconioses in Minnesota during the period 2000-2014. In addition to the total pneumoconiosis hospitalizations, data are shown separately for asbestosis and silicosis, which together added up to 97% of the pneumoconiosis hospitalizations in Minnesota. While counts and rates are not shown separately by gender or age, 97% of the pneumoconiosis cases during 2000-2014 were among males, and 89% were age 65 and older. Over the fifteen-year period, there was an annual average of 336 people admitted to a hospital for all types of pneumoconioses, 303 hospitalizations for asbestosis, and 22 people admitted to a hospital for silicosis.
Number of people Hospitalized with Pneumoconiosis in Minnesota (Age 15 or Greater), 2000-2014
| Year | Number | Rate* per million residents |
| 2000 | 262 | 70.5 |
| 2001 | 304 | 80.9 |
| 2002 | 306 | 79.8 |
| 2003 | 317 | 81.6 |
| 2004 | 328 | 83.9 |
| 2005 | 346 | 87.2 |
| 2006 | 288 | 71.2 |
| 2007 | 412 | 101.4 |
| 2008 | 412 | 98.9 |
| 2009 | 311 | 73.4 |
| 2010 | 400 | 91.8 |
| 2011 | 387 | 90.3 |
| 2012 | 338 | 78.3 |
| 2013 | 308 | 70.7 |
| 2014 | 325 | 74.1 |
Number of People in Total Admitted to Hospitals with Pneumoconiosis in Minnesota, 2000-2014
Rate of Total Number of People Hospitalized with Pneumoconiosis per Million People in Minnesota, 2000-2014
Number and Rate of people Admitted to a Hospital Because of Asbestosis in Minnesota, 2000 - 2014
| Year | Number | Rate* per Million Residents |
| 2000 | 230 | 60.8 |
| 2001 | 249 | 65.8 |
| 2002 | 272 | 69.8 |
| 2003 | 279 | 71.3 |
| 2004 | 290 | 73.8 |
| 2005 | 314 | 79.4 |
| 2006 | 266 | 65.3 |
| 2007 | 380 | 92.6 |
| 2008 | 380 | 90.3 |
| 2009 | 284 | 66.5 |
| 2010 | 369 | 84.8 |
| 2011 | 344 | 77.7 |
| 2012 | 310 | 71.8 |
| 2013 | 285 | 65.5 |
| 2014 | 300 | 68.4 |
*Age standardized rates were created with the use of eight, ten-year age categories.
Number of People Admitted to a Hospital because of Asbestosis in Minnesota, 2000-2014
Rate of People Admitted to a Hospital because of Asbestosis per Million People in Minnesota, 2000-2014
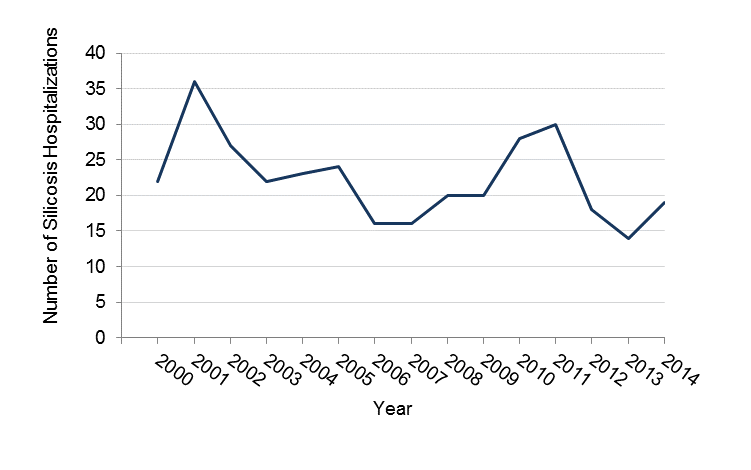
Number and Rate of People admitted to the Hospital with Silicosis in Minnesota, 2000-2014
| Year | Number | Rate* per million residents |
| 2000 | 22 | 5.6 |
| 2001 | 36 | 7.8 |
| 2002 | 27 | 5.3 |
| 2003 | 22 | 5.6 |
| 2004 | 23 | 5.3 |
| 2005 | 24 | 4.7 |
| 2006 | 16 | 3.5 |
| 2007 | 16 | 3.8 |
| 2008 | 20 | 4.5 |
| 2009 | 20 | 4.2 |
| 2010 | 28 | 6.3 |
| 2011 | 30 | 7.1 |
| 2012 | 18 | 4.2 |
| 2013 | 14 | 3.2 |
| 2014 | 19 | 4.3 |
*Age standardized rates were created with the use of eight, ten-year age categories.
Number of People admitted to the Hospital with Silicosis in Minnesota, 2000-2014
Rate of of People admitted to the Hospital with Silicosis in Minnesota, 2000-2014
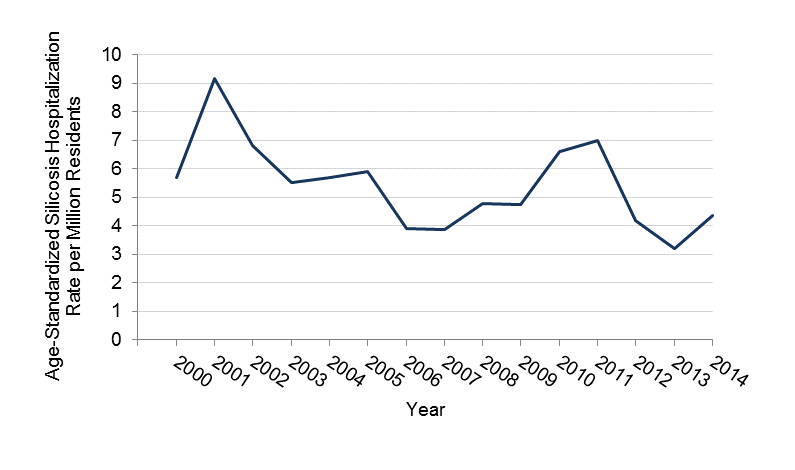
Trend analysis of the total number of people hospitalized with pneumoconiosis between 2000 and 2014 reveals that the number of people being admitted to the hospital is going up. This slightly increasing trend was due to asbestosis hospitalizations. The number of people admitted to a hospital with Asbestosis showed a significant increasing trend between 2000 and 2014, whereas silicosis showed a decreasing trend. The short time period (2000-2014) used in this analysis and the small numbers of cases (particularly for silicosis) limit the conclusions that can be drawn about whether the number of people admitted to a hospital with pneumoconioses are going up or down. Data from the NIOSH Work-Related Lung Disease Surveillance System from a much longer period of time (1970-2004) show dramatic declines in the estimated numbers of people admitted to a hospital with silicosis (from around 6,000 annual cases in the early 1970s to around 1,000 annual cases in the early 2000s). During the same time period, the number of people admitted to a hospital with asbestosis with around 1,000 cases per year during the 1970s to around 20,000 cases per year in the early 2000s. The trends in the number of people admitted to a hospital for silicosis and asbestosis are consistent with long-term trends in death rates (discussed further in the Pneumoconiosis indicator based on mortality). It is important to note that due to the long latency of these diseases, the number of people admitted to a hospital in a given year reflect exposures that occurred decades earlier.