Percentage of Workers Employed in Industries and Occupations at High Risk for Occupational Mortality
In 2014 in the United States, 4,821 individuals lost their lives because of an occupationally related injury. The fatal injury rate for the U.S. was 3.4 fatal injuries per 100,000 full-time equivalent workers. (See the Indicator for Fatal Work-Related Injuries for more information on Minnesota fatalities.) This indicator focuses on the proportion of workers employed in industries and occupations at high risk for fatal work-related injuries. “High risk” industries and occupations are defined here as those with a fatal injury rate two-fold or greater than the overall mortality rate for U.S.
Two data sources are used to create this indicator: data on industries and occupations with a fatality rate at least twice the overall national rate; and the number of workers employed in those industries and occupations in Minnesota. The number of employees in each high risk category is derived from the Current Population Survey conducted by the U.S. Census.
State and national data on all fatal work-related injuries in the U.S. comes from the Census of Fatal Occupational Injuries (CFOI) –conducted annually by the Bureau of Labor Statistics (BLS). The CFOI uses multiple data sources--death certificates, workers’ compensation reports, and federal and state agency administrative reports--to compile as complete a list as possible of all occupationally related fatal injuries that occur in the United States. The CFOI is a cooperative program between the states and the federal government and has been operational since 1992Summary information and statistics regarding job-related injuries, illnesses, and fatalities can also be found in the Minnesota Workplace Safety Dashboard available on the Minnesota Safety Council website (PDF).
As the overall work-related fatality rate has declined in the U.S, the threshold rate used in defining high risk industries and occupations (two-fold or greater rate) has also changed over time. For the time frame used in this indicator, different threshold rates were used for defining high risk industries and occupations. For the time period 2000-2002, a fatal injury rate of 10 was used (representing 27 industries and 24 occupations). For the period 2003-2007, high risk was defined as a fatality rate of 9.5 per 100,000 workers (representing 31 industries and 57 occupations). For the period 2008-2011, high risk was defined as a fatality rate of 7.5 deaths per 100,000 workers or higher (representing 40 industries and 62 occupations). For the period 2012-2014, high risk was defined as a fatality rate of 7.3 per 100,000 workers or higher (representing 38 industries and 63 occupations).
Due to the changing rates used to define industries and occupations at high risk of work-related deaths, trend analysis was limited to the five-year period 2003- 2007. No change was found in the percentage of Minnesotans employed in these occupations.
The percentages of workers in industries or occupations at high risk of fatal injuries in Minnesota are shown in the graphs and tables shown below. Lists of high risks industries and occupations for the most recent time period (2012-2014) are also shown below.
Percentage of Minnesotans Employed in High Mortality Risk Industries. 2000-2014
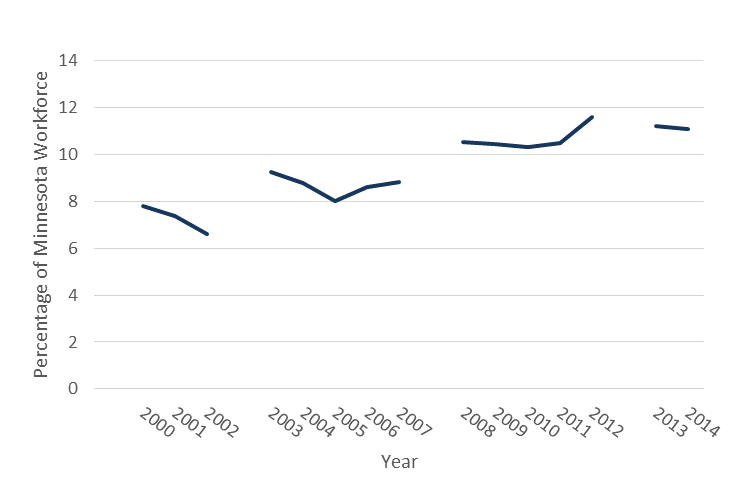
Percentage of Minnesotans Employed in High Mortality Risk Occupations, 2000-2014
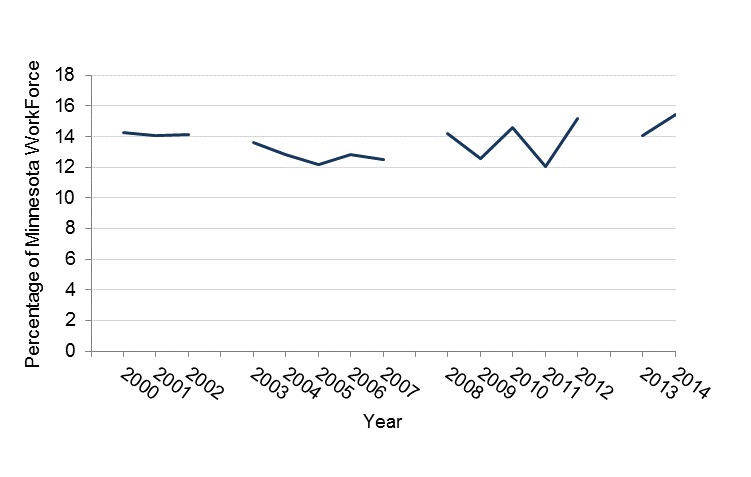
Percentage of Minnesotans Employed in High Mortality Risk Industries and Occupations, 2000-2014
| Year | Percentage in High Mortality Risk Industry | Percentage in High Mortality Risk Occupation |
| 2000 | 14.3 | 7.8 |
| 2001 | 14.1 | 7.4 |
| 2002 | 14.1 | 6.6 |
| 2003 | 13.6 | 9.3 |
| 2004 | 12.8 | 8.8 |
| 2005 | 12.2 | 8.0 |
| 2006 | 12.8 | 8.6 |
| 2007 | 12.5 | 8.8 |
| 2008 | 14.2 | 10.5 |
| 2009 | 12.6 | 10.5 |
| 2010 | 14.6 | 10.3 |
| 2011 | 12.1 | 10.5 |
| 2012 | 15.2 | 11.6 |
| 2013 | 14.1 | 11.2 |
| 2014 | 15.5 | 11.1 |
High Risk Industries for Mortality, 2012-2014
| Industries |
| Crop production |
| Animal production and aquaculture |
| Logging |
| Fishing, hunting, and trapping |
| Support activities for agriculture and forestry |
| Oil and Gas extraction |
| Coal mining |
| Metal ore mining |
| Nonmetallic mineral mining and quarrying |
| Support activities for mining |
| Construction |
| Agricultural chemical manufacturing |
| Cement, concrete, lime, and gypsum product manufacturing |
| Coating, engraving, heat treating, and allied activities |
| Commercial and service industry machinery manufacturing |
| Sawmills and wood preservation |
| Motor vehicle and motor vehicle part and supplies merchant wholesalers |
| Metals and minerals, except petroleum, merchant wholesalers |
| Recyclable material merchant wholesalers |
| Farm product raw material merchant wholesalers |
| Recyclable material merchant wholesalers |
| Farm product raw material merchant wholesalers |
| Petroleum and petroleum products merchant wholesalers |
| Farm supplies merchant wholesalers |
| Miscellaneous nondurable goods merchant wholesalers |
| Beer, wine, and liquor stores |
| Fuel dealers |
| Water transportation |
| Truck transportation |
| Taxi and limousine service |
| Scenic and sightseeing transportation |
| Services incidental to transportation |
| Other consumer good rental |
| Commercial, industrial, and other intangible assets rental and leasing |
| Landscaping services |
| Waste management and remediation services |
| Business, technical, and trade schools and training |
| Vocational rehabilitation services |
| Recreational vehicle parks and camps, and rooming and boarding houses |
| Drinking places, alcoholic beverages |
The table list industries that had a fatal injury rate at least twice the overall rate for the U.S. during 2012-2014.
High Risk Occupations for Occupational Mortality, 2012-2014
| Occupation |
| Farmers, ranchers, and other agricultural managers |
| Surveyors, cartographers, and photogrammetrists |
| Athletes, coaches, umpires, and related workers |
| Entertainers and performers, sports and related workers, all other |
| Crossing guards |
| First-line supervisors of landscaping, lawn service, and grounds keeping workers |
| Grounds maintenance workers |
| Animal trainers |
| Tour and travel guides |
| First-line supervisors of farming, fishing, and forestry workers |
| Miscellaneous agricultural workers |
| Fishers and related fishing workers |
| Logging workers |
| First-line supervisors of construction trades and extraction workers |
| Brickmasons, blockmasons, and stonemasons |
| Cement masons, concrete finishers, and terrazzo workers |
| Construction laborers |
| Paving, surfacing, and tamping equipment operators |
| Operating engineers and other construction equipment operators |
| Electricians |
| Insulation workers |
| Painters, construction, and maintenance |
| Roofers |
| Structural iron and steel workers |
| Helpers, construction trades |
| Fence erectors |
| Highway maintenance workers |
| Septic tank servicers and sewer pipe cleaners |
| Derrick, rotary drill, and service unit operators, oil, gas, and mining |
| Mining machine operators |
| Roustabouts, oil and gas |
| Other extraction workers |
| First-line supervisors of mechanics, installers, and repairers |
| Radio and telecommunications equipment installers and repairers |
| Bus and truck mechanics and diesel engine specialists |
| Heavy vehicle and mobile equipment service technicians and mechanics |
| Small engine mechanics |
| Miscellaneous vehicle and mobile equipment mechanics, installers, and repairers |
| Heating, air conditioning, and refrigeration mechanics and installers |
| Maintenance and repair workers, general |
| Maintenance workers, machinery |
| Millwrights |
| Electrical power-line installers and repairers |
| Telecommunications line installers and repairers |
| Rolling machine setters, operators, and tenders, metal and plastic |
| Sawing machine setters, operators, and tenders, wood |
| Miscellaneous plant and system operators |
| Crushing, grinding, polishing, mixing, and blending workers |
| Supervisors of transportation and material moving workers |
| Aircraft pilots and flight engineers |
| Driver/sales workers and truck drivers |
| Taxi drivers and chauffeurs |
| Motor vehicle operators, and all other |
| Railroad conductors and yardmasters |
| Sailors and marine oilers |
| Ship and boat captains and operators |
| Crane and tower operators |
| Dredge, excavating, and loading machine operators |
| Hoist and winch operators |
| Pumping station operators |
| Refuse and recyclable material collectors |