Drug Overdose Prevention
Related Topics
Differences in Rates of Drug Overdose Deaths by Race
View/download the report - Differences in Rates of Drug Overdose Deaths by Race (PDF).
Why this report is needed: African American and American Indian populations are dying from drug overdose deaths in Minnesota at unequal rates compared to whites. All program and policy decisions about substance use disorder must include a racial equity lens in order to address the race rate disparity within African American and American Indian populations.
These data and information are intended to inform drug overdose epidemic response and substance use disorder prevention efforts. The race rate disparities in drug overdose deaths mirror other racial disparities in Minnesota, like those seen in graduation rates, infant mortality, poverty, incarceration, removal from home, unemployment, home ownership, and suicide.
Who is included in this report: This report is an analysis of disparities based on race in drug overdose deaths within Minnesota. This report does not focus on nonfatal overdose or substance use disorder treatment. The three groups included are African American1, American Indian, and whites. Other racial groups are not included because they have lower drug overdose mortality rates relative to whites.
How a drug overdose death is determined and counted: Drug overdose death data come from Minnesota death certificates. After a death occurs, a death investigation is completed, along with an autopsy and toxicology testing, and a medical examiner or coroner makes a determination of the cause and manner of death. The medical examiner or coroner may list specific drugs on the death certificate determined to be involved or that caused the death.
Summary:
- Minnesota’s overall drug overdose mortality rate masks racial disparities.
- This report includes preliminary 2019 data. While not final, preliminary data are indicative of final results.
- In 2019, African Americans were almost two times more likely to die of a drug overdose than whites
- In 2019, American Indians were seven times more likely to die of a drug overdose than whites.
- Drug overdose mortality rates trended up for all races (African Americans, American Indians, and whites) and the race rate disparities have increased from 2010-2019.
- The age distribution of drug overdose deaths differs between African Americans, American Indians, and whites.
- For whites, African Americans, and American Indians, opioids are the leading cause of drug overdose death. Over the past 15 years, however, there were increases in overdose deaths in all drug categories, including benzodiazepines, psychostimulants (e.g., methamphetamine), heroin, and synthetic opioids (e.g., fentanyl and fentanyl analogues.
Understanding overdose disparities
In Minnesota, African Americans and American Indians die of drug overdoses at higher rates than whites. African American Minnesotans are two times more likely to die of a drug overdose than white Minnesotans. American Indian Minnesotans are seven times more likely to die of a drug overdose than white Minnesotans. These differences in overdose rates among these communities of color are due to systemic oppression and inequitable access to the resources people need to live a healthy life.
African Americans make up about 7% of the population and American Indians make up about 1.5% of the population in the state. Since the total number of African American and American Indian residents in Minnesota is small compared to the number of white residents, it is necessary to look at the rate of overdoses, rather than only the number, to make a fair comparison and to accurately describe the magnitude of the impact. The differences in rates are influenced by many different determinants of health.
Understanding determinants of health
Health starts where people live, learn, work, and play. Conditions of life are connected to healthy outcomes, especially when it comes to the treatment of chronic pain, mental health, and trauma. Determinants of health are the conditions within a home, family, school, and community that can impact a person’s ability to be healthy. Determinants of health include the physical characteristics of the neighborhood a person lives in, access to healthy food, safe housing, quality education, and economic well-being. Adverse childhood experiences (ACEs) are significant determinants of health that have been linked to an increased risk of mental health issues and substance use.
In Minnesota, factors like systemic racism have prevented communities of color (particularly African American and American Indian Minnesotans) from having equal access to the resources needed to be healthy. Poverty, ACEs, intergenerational trauma, and intergenerational substance use are all determinants of health influenced by systemic racism. The health inequities experienced by communities of color, as a result of determinants of health and systemic racism, result in overdose death disparities for communities of color.
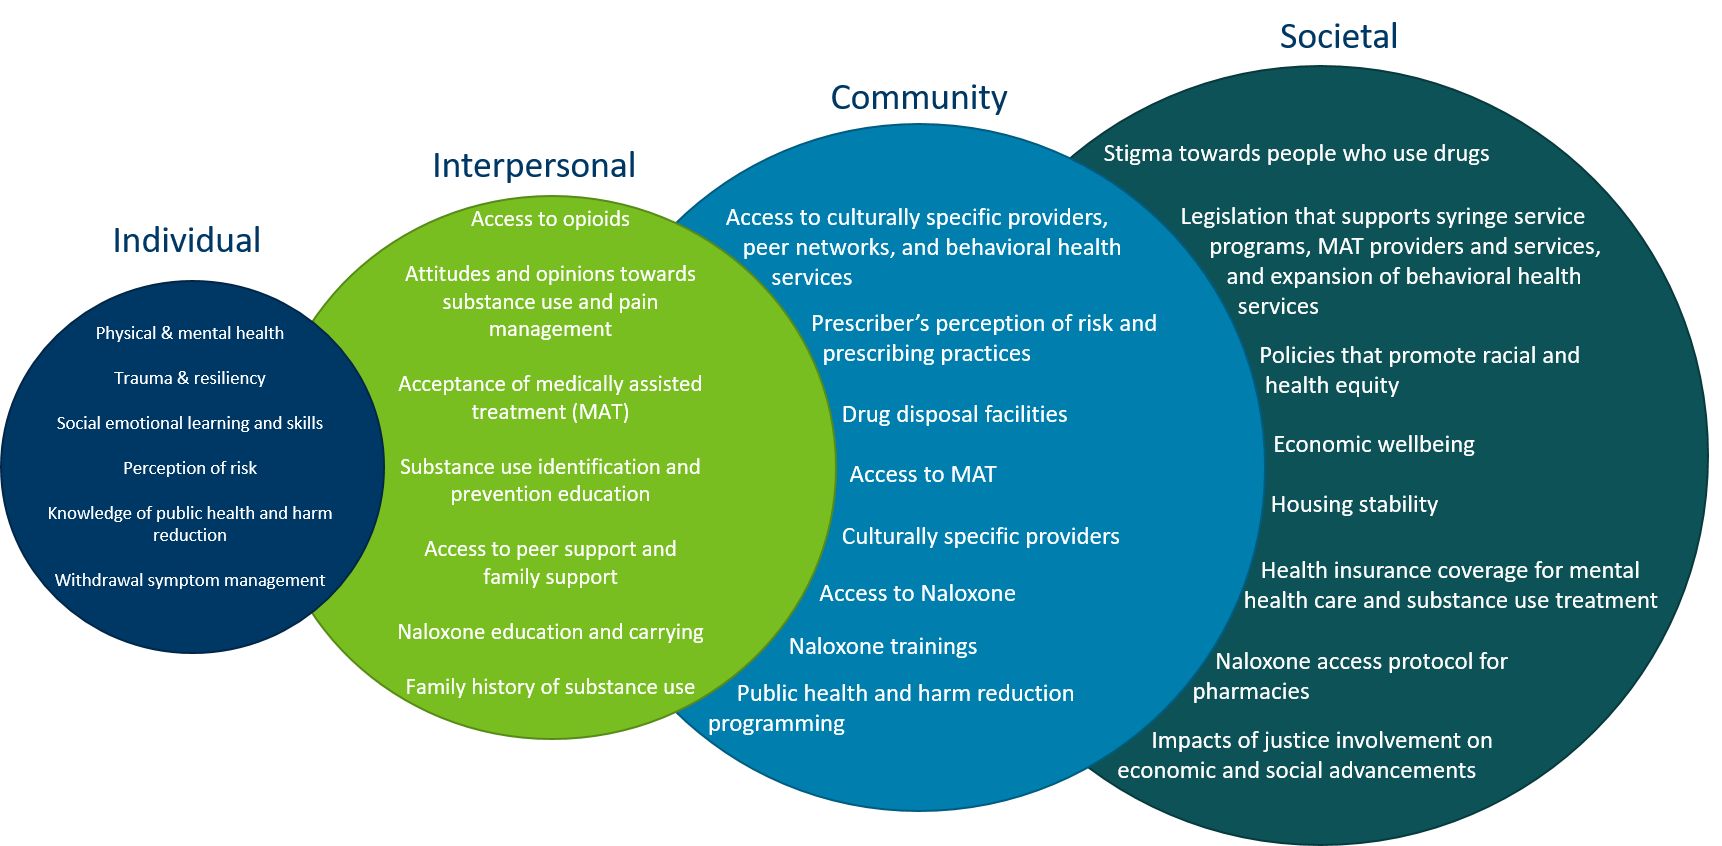
Reducing health disparities and overdose deaths within communities of color requires investments in prevention efforts at the individual, family, community, and policy levels (see Figure 1). For example, if a person has a strong early intervention of public health prevention education, continues to receive prevention messaging into adulthood, lives in a safe neighborhood, and has access to quality culturally specific health care, their ability to achieve and maintain a healthy lifestyle increases. When a person is financially secure, living in a safe place, and has health insurance, they can access treatment for medical, mental, and chemical health needs more easily.
Strategies to prevent substance use and overdose coordinated through a racial equity lens have the potential to reduce overdose death rate disparities in communities that are most impacted. Widespread public health initiatives that provide culturally specific supports at every stage of life can reduce health disparities and have positive outcomes on the quality of life for all Minnesotans.
Figure 1. Example of how determinants of health influence overdose disparities
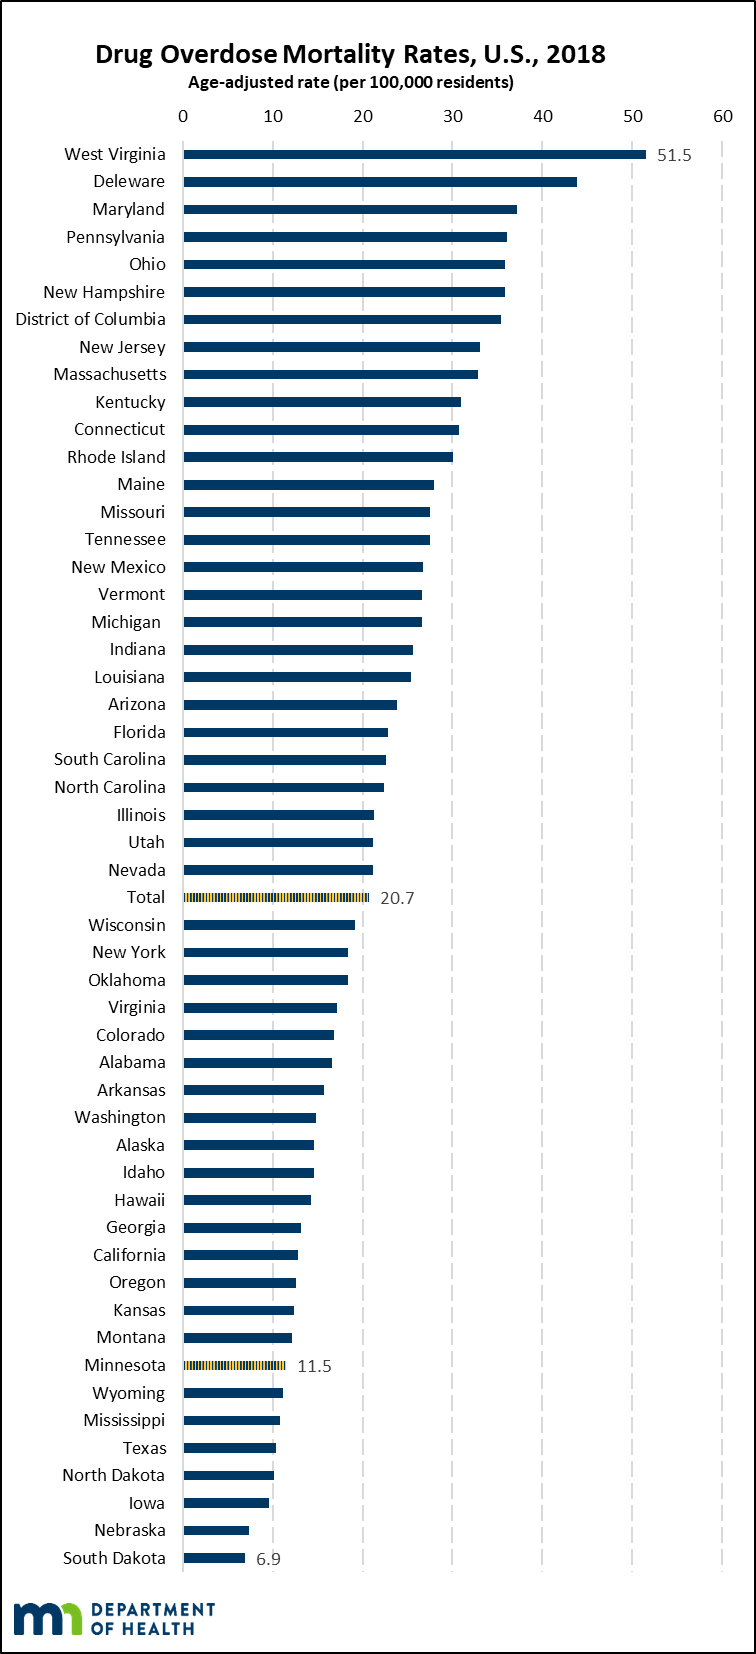
Minnesota ranked eighth lowest among all states and the District of Columbia in drug overdose mortality in 2018 (11.5 per 100,000 residents) (Chart 1). Minnesota moved slightly lower in the ranking from 2017 where Minnesota ranked twelfth lowest among all states and the District of Columbia. Similar to the trend seen across the U.S., Minnesota’s overall drug overdose mortality rates have continued to trend upwards over the past 20 years.
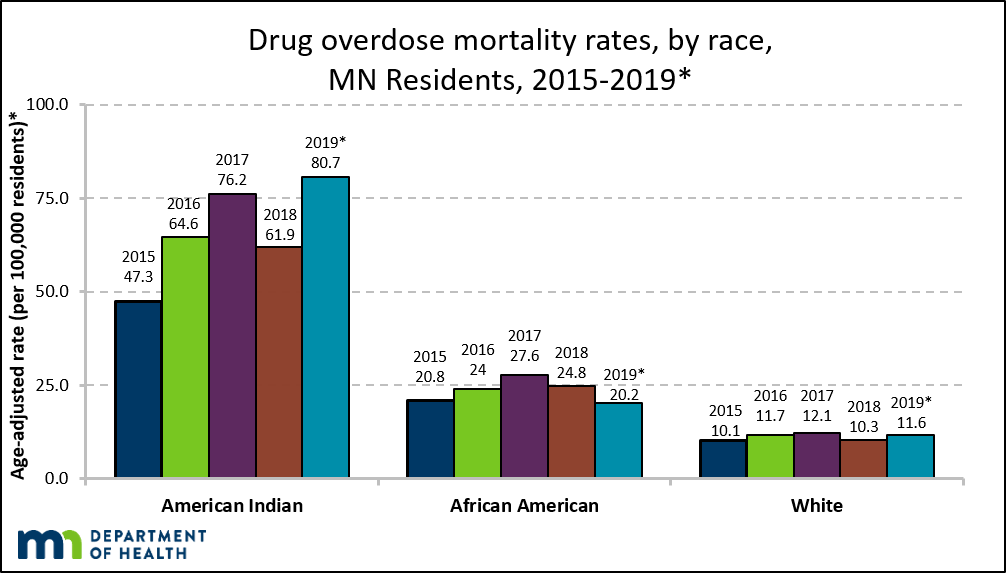
CHART 2. In 2019, African Americans were almost two times more likely to die of a drug overdose than whites. American Indians were seven times more likely to die of drug overdose than whites.
SOURCE: Minnesota death certificates, Injury and Violence Prevention Section, Minnesota Department of Health, 2015-2019
NOTE: 2019 data are preliminary and are likely to change when finalized.
While Minnesota has one of the lowest drug overdose mortality rates in the U.S., Minnesota has some of the worst race rate disparities in drug overdose mortality in the nation. In 2019, African American Minnesotans were almost two times more likely to die from a drug overdose than white Minnesotans. American Indian Minnesotans were seven times more likely to die from a drug overdose than white Minnesotans. Other states have drug overdose mortality disparities based on race. However, in 2018, the race rate disparities in drug overdose mortality rates between American Indians and whites was the largest drug overdose mortality rate disparity based on race in the U.S.; the drug overdose mortality rate disparity between African Americans and whites was the second greatest drug overdose mortality rate disparity based on race in the U.S.
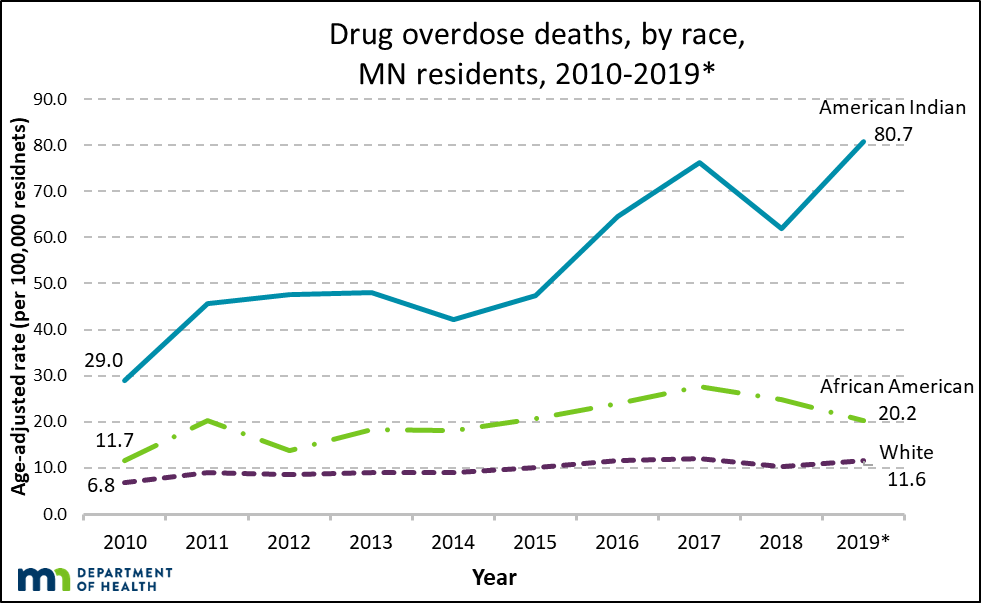
CHART 3. Disparities in drug overdose mortality rates have grown from 2010 to 2019.
SOURCE: Minnesota death certificates, Injury and Violence Prevention Section, Minnesota Department of Health, 2010-2019
NOTE: 2019 data are preliminary and are likely to change when finalized.
The mortality rate disparity between American Indians and whites continued and worsened in 2019. From 2010 to 2019, the American Indian mortality rate almost tripled from 29.0 per 100,000 to 80.7 per 100,000 (178% increase), and was seven times as high as the white mortality rate.
The mortality rate disparity between African Americans and whites continued in 2019. From 2010 to 2019, the African American mortality rate increased from 11.7 per 100,000 to 20.2 per 100,000 (73% increase), and was almost two times as high as the white mortality rate.;
For comparison, the white mortality rate increased from 6.8 per 100,000 to 11.6 per 100,000 (71% increase) over the same time period. Recently, the white mortality rate has remained stable within a narrow range of 10.0 to 12.0 per 100,000 since 2015. When the 2019 mortality numbers are finalized these rates are likely to increase.;
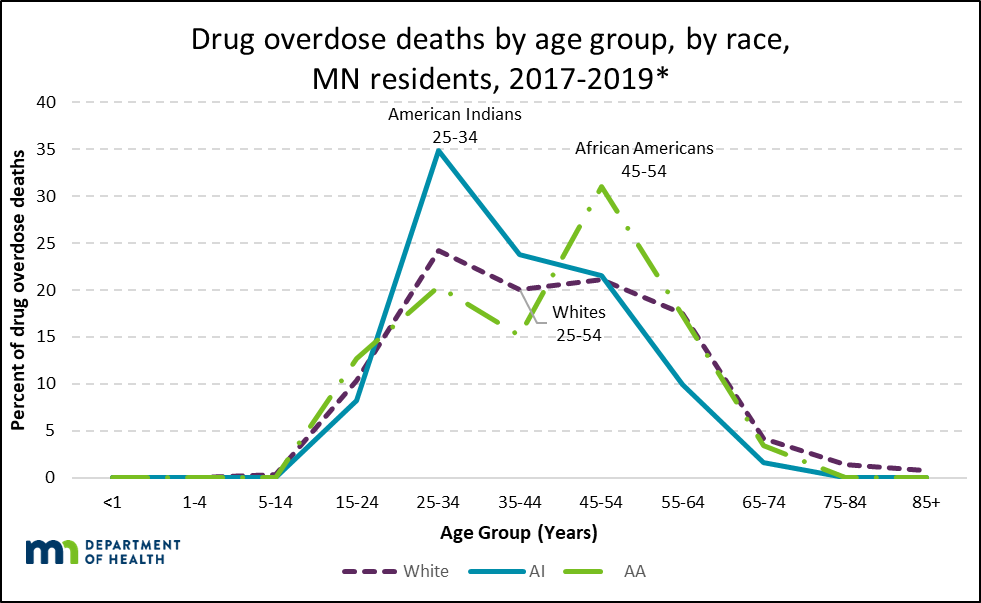
CHART 4. American Indian deaths primarily occurred within the 25-34 year age group. African American deaths primarily occurred within the 45-54 year age group.
SOURCE: Minnesota death certificates, Injury and Violence Prevention Section, Minnesota Department of Health, 2017-2019
NOTE: 2019 data are preliminary and are likely to change when finalized.
The age group with the greatest percentage of death differs by race. For whites, drug overdose deaths occur primarily within the 25-54 year age groups. Among American Indians, the greatest percentage of deaths has been in the 25-34 year age group. For African Americans, the 45-54 year age group has the greatest percentage of deaths.
For whites, African Americans, and American Indians, opioids are the leading cause of drug overdose deaths. Over the past 17 years, however, there were increases in all drug categories, including benzodiazepines, psychostimulants (e.g., methamphetamine), cocaine, heroin, and synthetic opioids (e.g., fentanyl and fentanyl analogues). Each of the observed increases in drug categories within racial groups was statistically significant, meaning there is evidence against the rates being similar between years.
Note: Due to small total numbers in certain drug categories, three years of data are presented together to better estimate observed rates. Populations by race were estimated for 2019; final numbers are not yet available.
Changes in Drug Categories for Whites
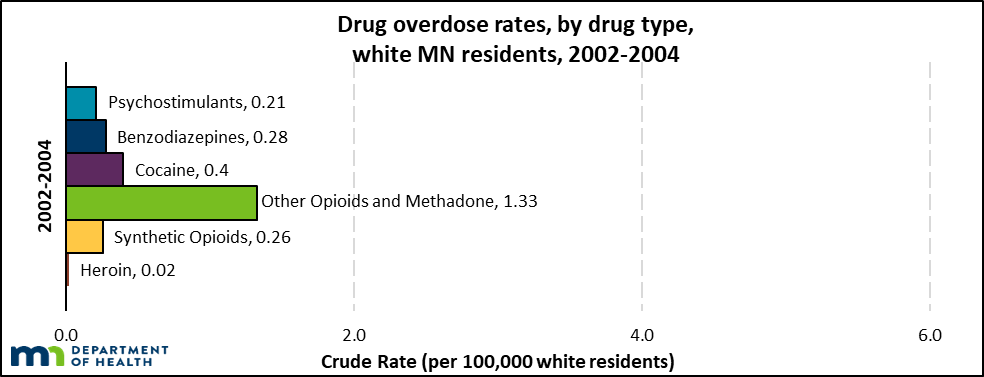
CHART 5. In 2002-2004, commonly prescribed opioids (i.e. other opioids and methadone) had the highest drug overdose mortality rate.
SOURCE: Minnesota death certificates, Injury and Violence Prevention Section, Minnesota Department of Health, 2002-2004
NOTE: Drug categories are non-exclusive. Overdose deaths may have involved more than one drug.
NOTE: Synthetic opioids include fentanyl. Psychostimulants include methamphetamines.
CHART 6. In 2017-2019, rates increased in most drug categories.
SOURCE: Minnesota death certificates, Injury and Violence Prevention Section, Minnesota Department of Health, 2017-2019*
NOTE: 2019 data are preliminary and are likely to change when finalized.
NOTE: Drug categories are non-exclusive. Overdose deaths may involve more than one drug.
NOTE: Synthetic opioids include fentanyl. Psychostimulants include methamphetamines.
From 2002-2004 to 2017-2019, the mortality rate increased across all drug categories for whites. Cocaine-involved mortality rates remained relatively stable. Psychostimulant-involved (e.g., methamphetamine) and benzodiazepine-involved deaths increased significantly. All opioids, including commonly prescribed, synthetic, and heroin, increased considerably. Within the white population, synthetic opioids were the leading cause of drug overdose death in 2017-2019. Opioids were involved in 53% of all drug overdose deaths in 2017-2019.
Changes in Drug Categories for African Americans
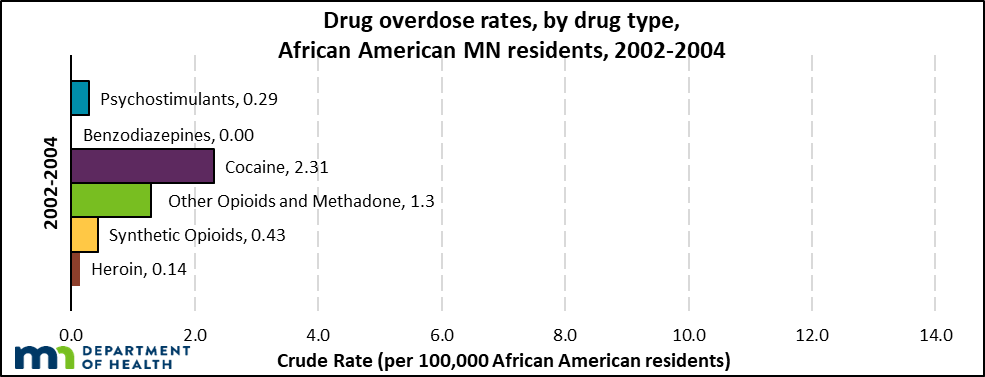
CHART 7. In 2002-2004, drug overdose rates involving cocaine were highest, followed by commonly prescribed opioids (i.e. other opioids and methadone)
SOURCE: Minnesota death certificates, Injury and Violence Prevention Section, Minnesota Department of Health, 2002-2004
NOTE: Drug categories are non-exclusive. Overdose deaths may involve more than one drug.
NOTE: Synthetic opioids include fentanyl. Psychostimulants include methamphetamines.
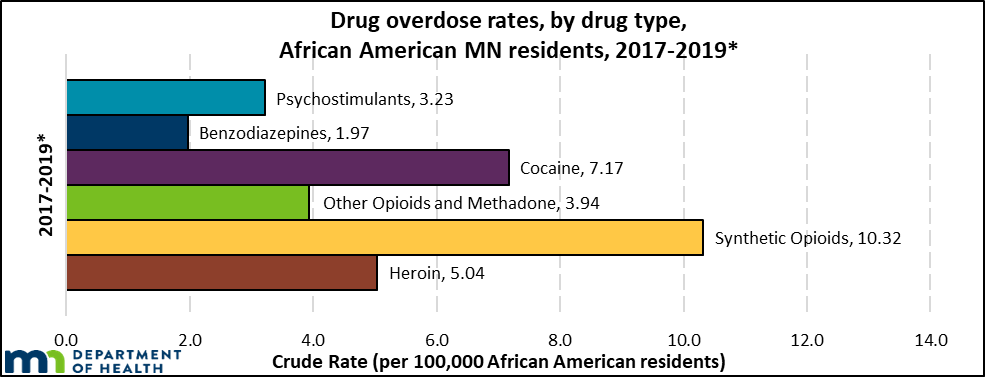
Drug overdose mortality rates increased in all drug categories, particularly synthetic opioids, cocaine, and heroin from 2002-2004 to 2017-2019.
SOURCE: Minnesota death certificates, Injury and Violence Prevention Section, Minnesota Department of Health, 2017-2019*
NOTE: 2019 data are preliminary and are likely to change when finalized.
NOTE: Drug categories are non-exclusive. Overdose deaths may involve more than one drug.
NOTE: Synthetic opioids include fentanyl. Psychostimulants include methamphetamines.
From 2002-2004 to 2017-2019, drug overdose mortality rates for all six drug categories – psychostimulants (e.g., methamphetamine), benzodiazepines, cocaine, and all opioid types, including commonly prescribed, synthetic, and heroin – increased substantially for African Americans. Within the African American population, synthetic opioids were the leading cause of drug overdose death in 2017-2019. Opioids were involved in 64% of all drug overdose deaths in 2017-2019.
Changes in Drug Categories for American Indians
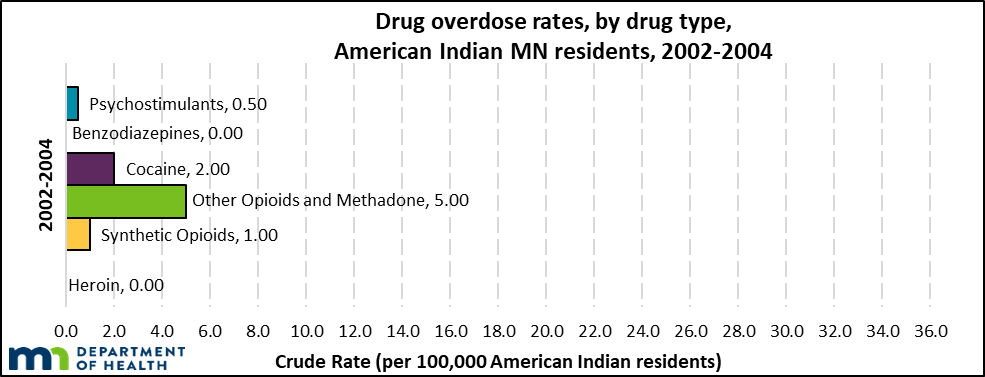
CHART 9. In 2002-2004, commonly prescribed opioids (i.e. other opioids and methadone) had the highest drug overdose mortality rate.
SOURCE: Minnesota death certificates, Injury and Violence Prevention Section, Minnesota Department of Health, 2002-2004
NOTE: Drug categories are non-exclusive. Overdose deaths may involve more than one drug.
NOTE: Synthetic opioids include fentanyl. Psychostimulants include methamphetamines.
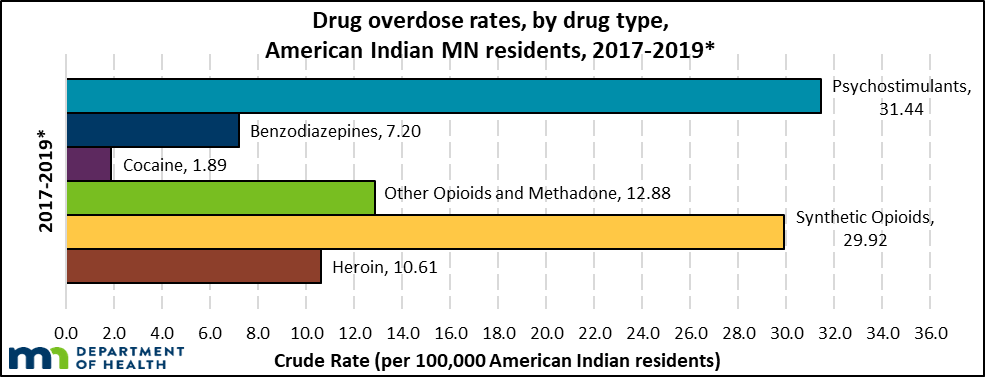
CHART 10. From 2002-2004 to 2017-2019, rates increased for all drug categories, particularly psychostimulants, synthetic opioids, and heroin.
SOURCE: Minnesota death certificates, Injury and Violence Prevention Section, Minnesota Department of Health, 2017-2019*
NOTE: 2019 data are preliminary and are likely to change when finalized.
NOTE: Drug categories are non-exclusive. Overdose deaths may involve more than one drug.
NOTE: Synthetic opioids include fentanyl. Psychostimulants include methamphetamines.
From 2002-2004 to 2017-2019, all drug categories, except for cocaine, increased for American Indians. Psychostimulant-involved (e.g., methamphetamine) deaths and benzodiazepine-involved deaths increased substantially. All opioid categories, including commonly prescribed, synthetic, and heroin, also increased substantially.
Within the American Indian population, psychostimulants were the leading cause of drug overdose death and synthetic opioids were the leading cause of opioid-involved death in 2017-2019. Opioids were involved in 64% of all drug overdose deaths in 2017-2019.
Discussion of Drug Categories among African American, American Indian and white Drug Overdose Deaths:
For African American and American Indian Minnesotans, there were zero benzodiazepine-involved deaths in 2002-2004. Benzodiazepine-involved deaths rose significantly over the next 17 years in African American, American Indian, and white communities. Using benzodiazepines and opioids together is linked to a significant increase in risk of opioid overdose.
While commonly prescribed opioid involved deaths have begun to decrease statewide, synthetic opioid deaths are increasing rapidly. The shift from commonly prescribed opioids to illicit forms of opioids bring additional challenges in stigma, and consequently, access to treatment and recovery supports.
Psychostimulants, synthetic opioids, and heroin can be injected into the bloodstream through a vein. The increases in psychostimulant-, synthetic opioid-, and heroin-involved deaths points to an increase in injection drug use, because injection is a common way to put these drugs into the body. Injection drug use brings additional risk factors including the spread of infectious diseases and additional physical health problems.
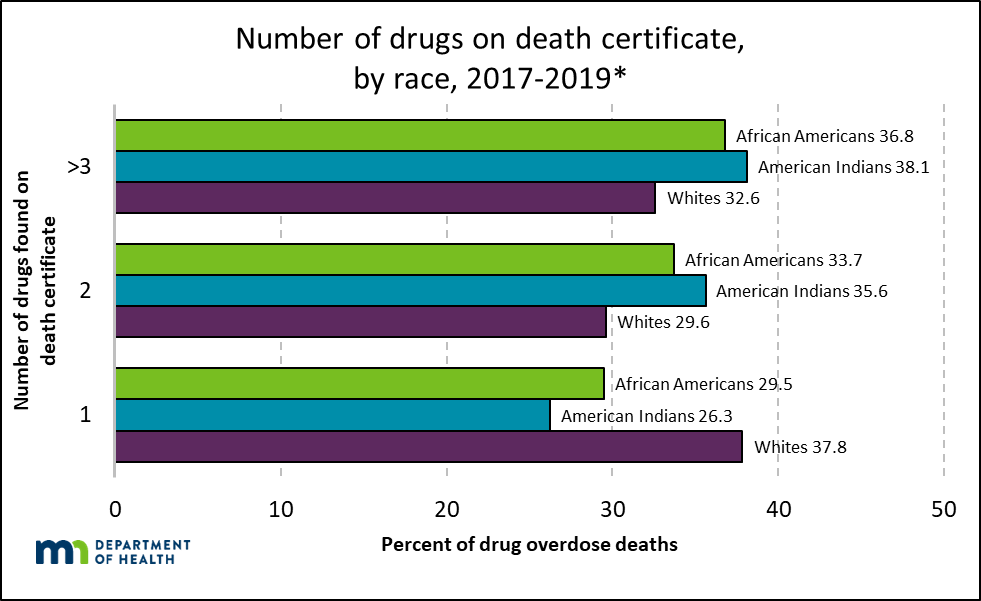
CHART 11: A greater percentage of African American and American Indian drug overdose deaths had multiple drugs listed on the death certificate.
SOURCE: Minnesota death certificates, Injury and Violence Prevention Section, Minnesota Department of Health, 2017-2019*;
NOTE: 2019 data are preliminary and are likely to change when finalized.
A statistically significant greater percentage of African American and American Indian drug overdose deaths involved more than one drug compared to whites:
- 62% of drug overdose deaths among whites involved more than one drug.
- 71% of drug overdose deaths among African Americans involved more than one drug.
- 74% of drug overdose deaths among American Indians involved more than one drug.
Knowing that there are multiple drugs involved in a death has several implications, including, but not limited to:
- Responding to an overdose is more challenging when multiple substances are present, especially if there are opioids and non-opioids mixed.
- Tapering, withdrawal management, and treatment have additional considerations when polysubstance use is present.
Medical examiners and coroners must know what drugs are available in the community in order to know what to test for in toxicology during the death investigation.
For more information on intersecting topics, please visit:
- Opioid Dashboard: a one-stop shop for opioid-related data and information.
- MDH Health Equity Report: a report to the legislature that includes recommendations for advancing health opportunities in Minnesota
- Pain Management: finding effective, long-term solutions for acute and chronic pain
Language of Substance Use Disorder: terms related to opioid use, misuse, and substance use disorder
Identification of Substance Use Disorder: screening and diagnosis of substance use disorder
Injection Drug Use: additional risk factors and considerations when drugs are injected.
Infectious Disease: the relationships between substance use and infectious disease
