MN Tracking
Related Programs
Health Promotion and Chronic Disease Division
Centers for Disease Control and Prevention
Environmental Health Division
Contact Info
Heat Vulnerability in Minnesota and Wisconsin
What's the problem?
![]()
Extreme heat events in Minnesota and Wisconsin are already occurring and are expected to become more common, more severe, and longer lasting as our climate changes. Extreme heat causes entirely preventable illness and death.
For years, staff in the Minnesota and Wisconsin Environmental Public Health Tracking programs used similar messaging about how older adults, infants and people with chronic health conditions—particularly in urban areas—were more likely to suffer from heat-related illness. Anecdotally, our programs started noticing more cases of heat-related illness outside of these populations.
Our states teamed up to build a more robust dataset to better understand who is most impacted by extreme heat. Because Minnesota and Wisconsin have similar climates, populations and patterns of heat-related illness, we decided to combine our data and work together to assess current trends and patterns.
What did we do?
In 2017, our state Environmental Public Health Tracking programs began discussing heat-related illness and how to frame an analysis. We decided to base the analysis on the following data:
- Emergency department data. Any Minnesota or Wisconsin resident who went to the emergency department for heat-related illness during warm weather months (May-September) from 2006-2015 were included in the analysis. Veteran’s Administration and Indian Health Services hospitals were not included in the analysis.
- Risk factor data. Staff pulled data on known risk factors for heat-related illness, such as being an older adult or living in poverty. In total, we assessed 17 county-level variables linked to heat-related illness, as identified by the Wisconsin and Minnesota Climate and Health Programs.
With the emergency department data, we ran several statistical tests to measure differences among age, sex, insurance status, county and month and year of admission. We assessed patterns of correlation to see which risk factors were associated with heat-related illnesses.
These county-level risk factors included urban and rural designations, climate regions, percent of elderly population living alone, people below the poverty threshold, percent of population with limited English proficiency, and occupation.
What we learned
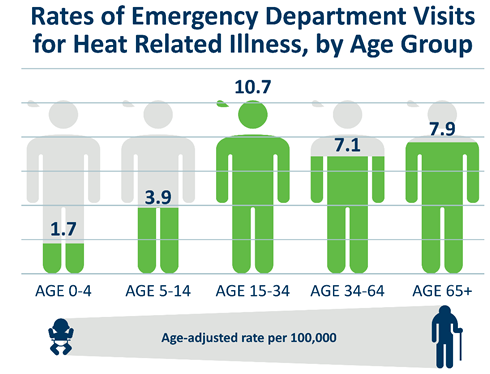
- People 15-34 years of age are most likely to visit the emergency department for heat-related illness. While our messaging often focuses on the very young and the very old, we learned that in our states, a younger age group was more likely to go to the emergency department for being sick from the heat.
- Men are about twice as likely to visit the emergency department for heat-related illness as women.

We learned that in our states, men were more likely than women to report to the emergency department with heat-related illness. While we don’t know precisely why this is, it could be related to specific occupations. Further research will need to explore the true reason for this.
- For counties as a whole, heat-related illness rates are significantly higher in rural areas than in metropolitan areas.
In the past, we have specifically mentioned urban areas as areas at increased risk due in part to the urban heat island effect, when concrete and asphalt in cities absorb and hold heat and can increase temperatures. While age-adjusted rates were lower for urban counties in both states, sub-county data (e.g., zip code data) were not included in our analysis; pockets within a county could have more cases of heat-related illness.For example, Milwaukee County is almost 1,200 square miles; while the overall rate might be low compared to some rural counties, certain spots in the downtown area could have rates that are quite high. Counties with a higher heat index generally had more cases of heat-related illness.
When we looked at the average maximum heat index in a county, we found more cases of heat-related illness. It makes sense that the hotter it is, the more people get sick from the heat.Here is a map of Minnesota Average Summer heat index by county, 2014-2016.
What’s next?
Together, the Minnesota and Wisconsin Tracking programs will work with our Climate and Health Programs to build on our understanding of extreme heat. We will use these findings to tailor messages for specific audiences on websites, in videos, at festivals and in print materials. We still have to be concerned about the elderly and the very young during intense periods of heat, but our data show that there are other populations that may need to be informed of their risk. Our programs will continue to find new ways to proactively protect the health of these at-risk groups.
Learn more
Use the resources below to learn more about extreme heat safety and access your county’s data.
Minnesota
Wisconsin
- Heat-related health and safety tips
- Heat-related illness data in County Environmental Health Profiles
