Tools and Training
Flowchart
On this page:
What is a flowchart?
How to create a flowchart
Examples of flowcharts
More information
Sources
What is a flowchart?
A flowchart identifies the actual flow of events in a process, in comparison to the prescribed or ideal flow of events. A flowchart can show where complexity or redundancy occurs, allow a team to agree on process steps, and compare an actual process with the ideal process. It can show where additional data should be collected, and serve as a training aid.
How to construct a flowchart
- Clearly define the starting point—where the process begins—and the ending point
- Determine the steps in the process, and place them in sequence as they currently stand
- Walk through the flowchart with your team to theoretically test the flowchart's accuracy
Interpretation
- Analyze the flow of events relative to standard practice or the ideal flow
- Look for duplication of effort or unnecessary wait time
- Consider the complexity of the process and how it could be simplified
- Determine whether there is variation in how different people follow the process
Example flowcharts
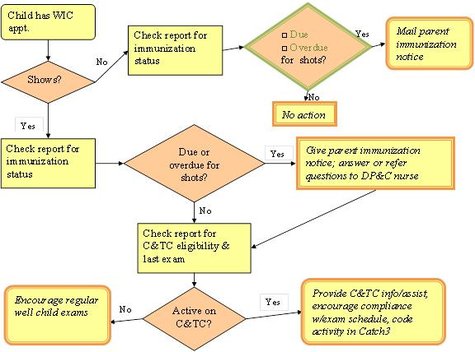
Countryside Community Health Board: Checking Immunization Status

Rabies Prevention Flowchart (PDF)
Los Angeles County Dept. of Public Health
More information
Flowchart
American Society for Quality
Video Whiteboard: Flowchart (7:45)
YouTube: Institute of Healthcare Improvement
Source
Public Health Memory Jogger
Public Health Foundation, GOAL/QPC