Tools and Training
Interrelationship Digraph
On this page:
What is an interrelationship digraph?
How to Construct an interrelationship digraph
Examples
More information
Sources
What is an interrelationship digraph?
Interrelationship digraphs show cause-and-effect relationships, and help analyze the natural links between different aspects of a complex situation.
An interrelationship digraph:
- Encourages team members to think in multiple directions rather than linearly
- Explores the cause and effect relationships among all the issues, including the most controversial
- Allows key issues to emerge naturally rather than to be forced by a dominant or powerful team member
- Systematically surfaces the basic assumptions and reasons for disagreements among team members
- Allows a team to identify root cause(s) even when credible data does not exist
When to use an interrelationship digraph
- When trying to understand links between ideas or cause-and-effect relationships
- When a complex issue is being analyzed for causes
- When a complex solution is being implemented
- After generating an affinity diagram, fishbone diagram, or tree diagram, to more completely explore the relations of ideas
How to construct an interrelationship digraph
1. Draft a problem statement
- If using an original statement (not from a previous tool or discussion), write a complete sentence
- Everyone needs to clearly understand and agree on the problem statement
- Write or place the problem statement at the top of the workspace
2. Brainstorm ideas
Brainstorm ideas and write each one on a separate note card or piece of paper.
If using with another tool (e.g., affinity diagram, fishbone diagram), take ideas from the most detailed row or final branches. Use these ideas to brainstorm other ideas.
3. Determine relationships between ideas
- Place the cards in a circle on the wall.
- For each idea, ask, "Does this idea cause or influence any other idea?" Draw arrows from an idea to the ones it causes or influences. Repeat the question for each idea.
- Draw only one-way relationship arrows in the direction of the stronger cause or influence.

4. Analyze the diagram
- Count the arrows in and out for each idea. Write the counts at the bottom of each box. The ones with the most arrows are the key ideas.
- Note which ideas have primarily outgoing (from) arrows. These are basic causes or drivers.
- Note which ideas have primarily incoming (to) arrows. These are final effects that also may be critical to address.
- Be sure to check whether ideas with fewer arrows also are key ideas. The number of arrows is only an indicator, not an absolute rule. Draw bold lines around the key ideas.
5. Next steps
Use common sense when you select the most critical issues to focus on. Issues with very close tallies must be reviewed carefully but in the end, it is a judgment call, not science.
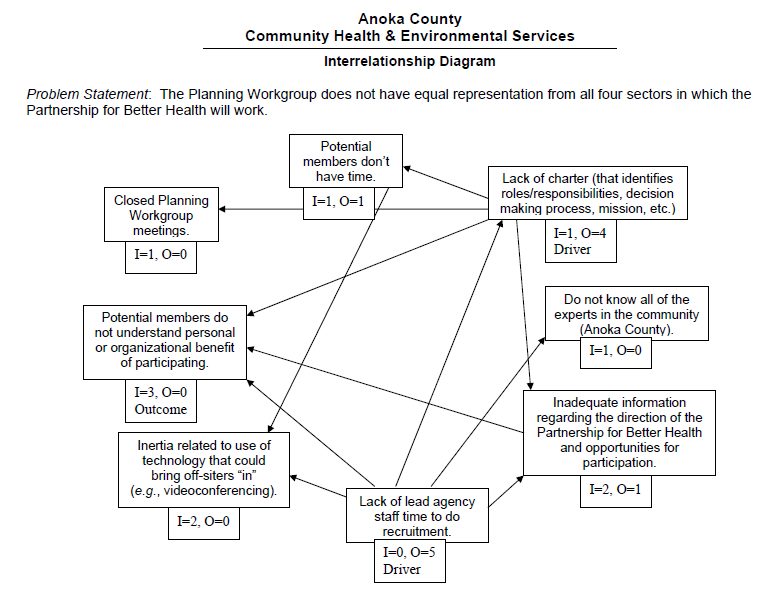
Example interrelationship digraph
Click to view larger.
More information
What is an Interrelationship Diagram?
American Society for Quality
Interrelationship Digraph (PDF)
The Coach's Guide to the Memory Jogger
Sources
The Quality Toolbox
Nancy R. Tague
Public Health Memory Jogger
Public Health Foundation, GOAL/QPC