Tools and Training
Pareto Chart
On this page:
What is a Pareto chart?
How to construct a Pareto chart
Example Pareto chart
More information
Sources
What is a Pareto chart?
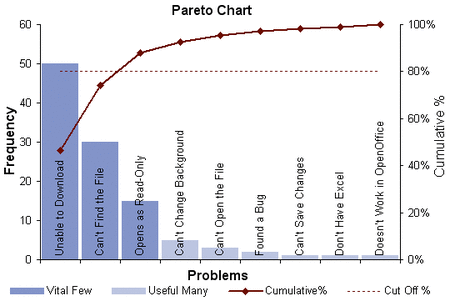
A Pareto chart helps a team focus on problems that offer the greatest potential for improvement, by showing different problems' relative frequency or size in a descending bar graph, which highlights the problems' cumulative impact. Teams can then focus on problem causes that could have the greatest impact if solved or improved.
The Pareto principle: 20% of sources cause 80% of problems.
How to construct a Pareto chart
1. Choose problem, potential causes
Select a problem for your team to analyze.
Next, choose potential problem causes, which your team will monitor, compare, and rank-order with an affinity diagram, or by using existing data.
2. Choose measurement units
Choose units of measurement common across all potential causes, like cost or frequency.
Choose a time period long enough to accurately represent the situation. Remember, the interval should take seasonality into account, as well as different patterns within days, weeks, or months.
3. Gather data
Gather data on your team's variables, and store in a spreadsheet.
4. Construct Pareto chart
Start to draft the Pareto chart: the chart's horizontal axis contains the problem categories and the vertical axis contains the measurement (cost, frequency, etc.).
Arrange the bars in descending order to assess which problem causes are occurring in the greatest amount—and therefore have the greatest potential to positively impact your problem if solved or improved.
You might also wish to draw a line that shows the cumulative total of each problem cause, as you progress across the chart. This line might help you assess which sources are causing "80% of the problems."
Example Pareto chart
Source: Goomedic
More information
Pareto Chart
Institute for Healthcare Improvement
Pareto Charts
USAID Assist Project
Pareto Charts
American Society for Quality
Pareto Analysis and Check Sheets
Oregon State Extension Service
Finding the Right Tool for your Purpose (PDF)
MDH Office of Performance Improvement
Pareto Chart [Note: Video will autoplay]
Western Regional Public Health Training Center
Source
Public Health Memory Jogger
Public Health Foundation, GOAL/QPC

