Tools and Training
Prioritization Matrix
Download: Prioritization matrix template (XLS)
On this page:
What is a prioritization matrix?
How to Construct a prioritization matrix
Examples of prioritization matrices
More information
Sources
What is a prioritization matrix?
A prioritization matrix can help an organization make decisions by narrowing options down by systematically comparing choices through the selection, weighing, and application of criteria. Prioritization matrices:
- Quickly surface basic disagreements, so disagreements can be resolved openly
- Force a team to narrow down all solutions from all solutions to the best solutions, which are more likely to increase chances for successful program implementation
- Limits "hidden agendas" by bringing decision criteria to the forefront of a choice
- Increases follow-through by asking for consensus after each step of the process
How to construct a prioritization matrix
There are three ways to construct prioritization matrices, but the Full Analytical Criteria Method is detailed below. This specific method is best used in smaller groups (3-8 people), which require few options (5-10 options) and few criteria (3-6 criteria). This specific method also requires the team to reach complete consensus on criteria and options. Stakes may be high if the plan fails.
1. Set a goal
In order to agree on the ultimate goal, your group should produce a clear goal statement through consensus.
![]()
2. Set criteria
Create a list of criteria by reviewing available documents or guidelines. The team must come to a consensus on criteria and their meaning, or the process is likely to fail.

3. Weigh criteria for importance
Use a matrix to weigh each criteria against another, in order to decide which criteria are most important.
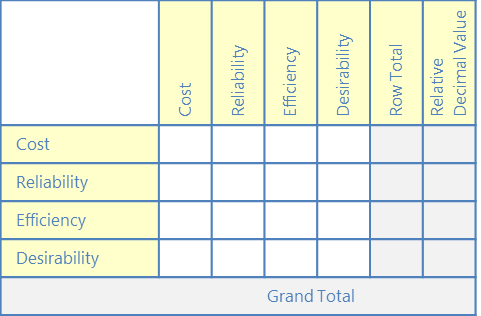
A. Write criteria
Write your criteria across the top of the columns. Add extra columns at the end for "Row Total" and "Relative Decimal Value" (you'll use those later). Write your criteria at the beginning of each row.
B. Weigh criteria
Begin the process of deciding which criteria are more important. (Since we can't compare a criterion against itself, we'll start in the second cell of the first column.)
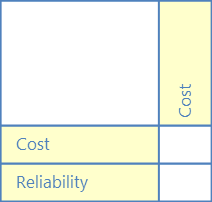
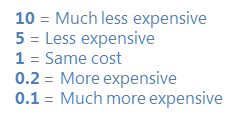
In this cell, ask yourself whether the criterion to the left (reliability) is more or less important than the criterion above (cost). Use the following weighting system to indicate whether it's more important, and by how much:
10 = Much more important
5 = More important
1 = Equally important
0.2 = Less important
0.1 = Much less important
Note: A whole number (10, 5, 1) should always represent the "desirable" rating. In some cases, this mean "more" of something (e.g., importance, reliability, educational value), and in others it may mean "less" (e.g., cost, travel time).
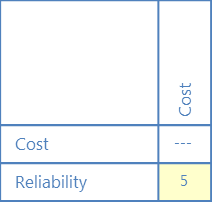 | This indicates that reliability is more important (5) than cost. |
Each time you record a weight in a row cell, you must record its reciprocal value in the corresponding column cell.
Weight of 10 --> Reciprocal value of 0.1
Weight of 5 --> Reciprocal value of 0.2
Weight of 1 --> Reciprocal value of 1
Weight of 0.2 --> Reciprocal value of 5
Weight of 0.1 --> Reciprocal value of 10
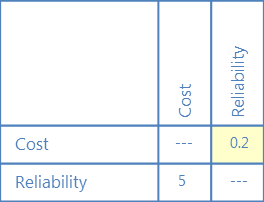 | The reciprocal value of 5 is 0.2; this shows that cost is less important (0.2) than reliability. |
Continue weighting the remaining criteria and recording reciprocal values.
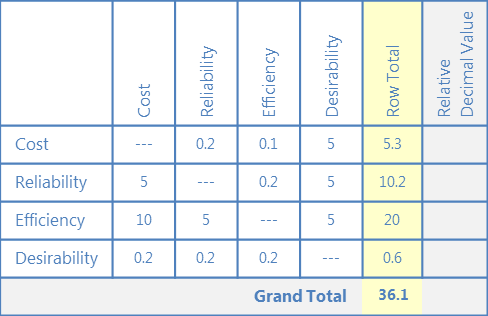
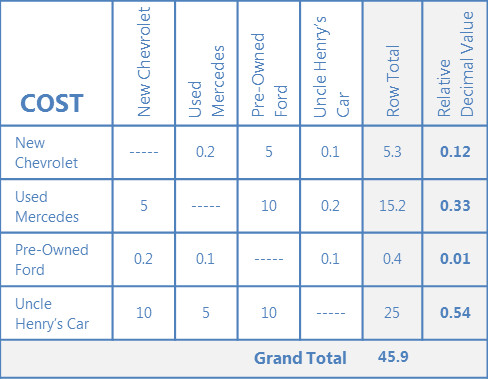
C. Calculate totals
When finished, total each horizontal row and enter the sum under "Row Total." Add all row totals to reach a grand total.
D. Calculate criteria weighting
Divide each row total by the grand total, and enter this under "Relative Decimal Value."
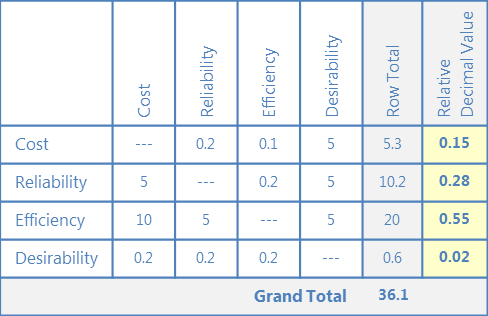
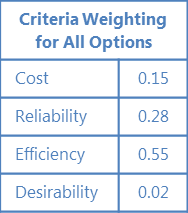
These relative decimal values indicate how relatively important each criterion is to you—they are now called your "criteria weighting."
You will use criteria weighting to compare options at the end of the process, in Step 6.
4. Weigh options against criteria
Use a set of matrices to weigh options within given criteria, in order to start deciding which options best meet your criteria.
A. Weigh options
Using the same weighting and method as above, place one criterion in the upper left corner of its own matrix, and weigh options against each other. Use weights to indicate which option better meets the matrix's single criterion.
Remember: A whole number (10, 5, 1) should always represent the "desirable" rating. In some cases, this mean "more" of something (e.g., importance, reliability, educational value), and in others it may mean "less" (e.g., cost, travel time).
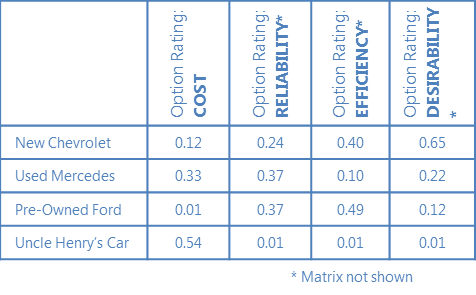
Repeat this step with each criterion (cost, reliability, efficiency, desirability) using the same options and weighting method, until you have a matrix for each criterion. There will be as many matrices as there are criteria.
These relative decimal values indicate how well each option meets a given criterion—they are now called your "option ratings."
B. Optional: Compile option ratings
You may find it helpful to put your option ratings from each matrix into a single table to minimize confusion.
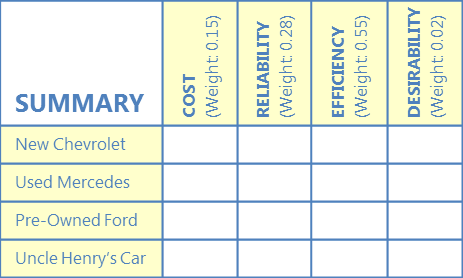
5. Compare options
Using another L-shaped matrix, compare each option based on all combined criteria.
A. Create summary matrix
List your criteria at the top of each column, along with their respective criteria weighting values from Step 3. Write each option at the beginning of a row.
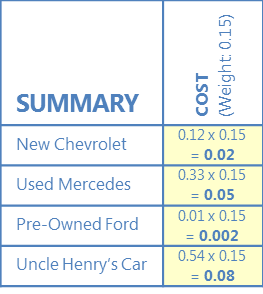
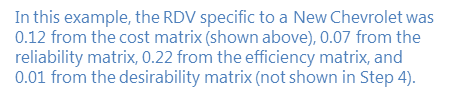
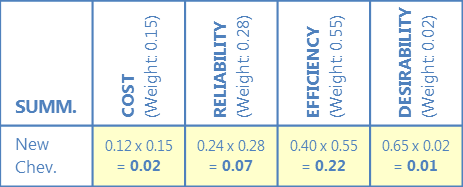
B. Multiply criteria weighting and option ratings
In each cell, multiply the criteria weighting values (found at the top of each column) by the option rating from each matrix in Step 4.
 |
|
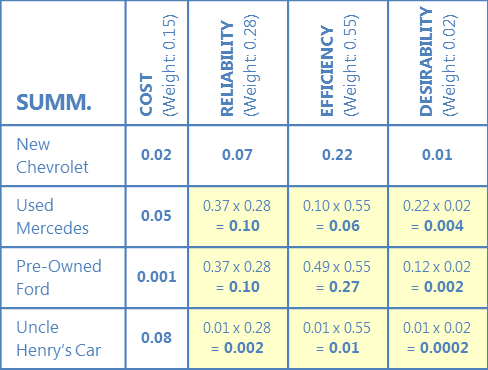
Repeat this for each option and criterion, pulling values from Steps 3 and 4.
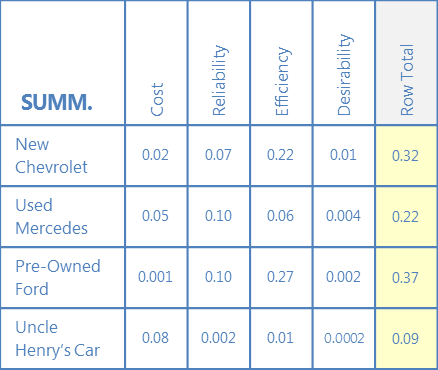
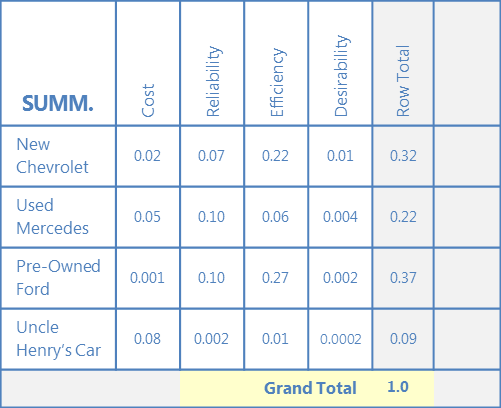
C. Calculate row total
Add values across each row to reach a row total.
D. Calculate grand total
Add all row totals to reach a grand total.
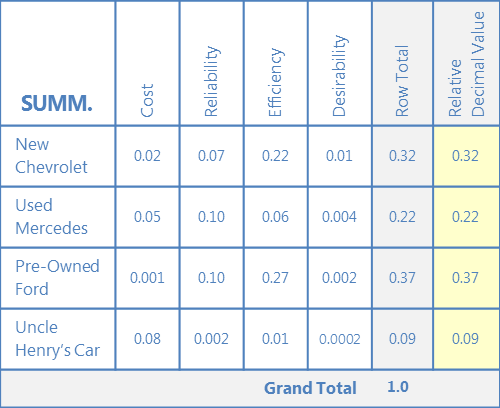
E. Calculate relative decimal value
Divide each row total by the grand total, and enter this under "Relative Decimal Value."
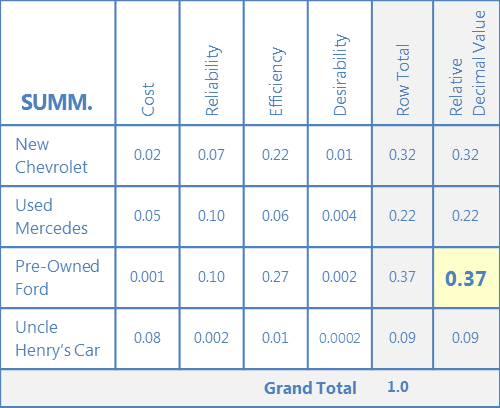
6. Choose the best option across all criteria
Compare the relative decimal values to decide which option is highest. This is the best choice given options and criteria.

Examples of prioritization matrices
Cooking Tasty Popcorn: Using an Old QI Tool in a New Way
National Association of County and City Health Officials (NACCHO)
Strategy Prioritization Matrix (DOC)
Healthy Kansas 2010
More information
Public Health Memory Jogger
Public Health Foundation, GOAL/QPC
Prioritization
Mind Tools
Source
Public Health Memory Jogger
Public Health Foundation, GOAL/QPC