Tools and Training
Radar Chart
On this page:
What is a radar chart?
How to create a radar chart
Example radar chart
More information
Sources
What is radar chart?
Radar charts show the gaps between current performance areas, and ideal performance areas. Use a radar chart to:
- Display important categories of performance, and define full performance for each category
- Show gaps between current and full performance
- Capture a range of perceptions about performance
- Provide data to support priorities for improving performance
How to create a radar chart
1. Assemble a team
Ensure your team is cohesive, with varied points of view.
2. Select and define rating categories
Brainstorm performance area headers (using an affinity diagram might be helpful), and define what full performance and non-performance look like.
3. Rate each category
Each team member should rate current performance in each category in silence. After this, you can also find a team rating for each category through consensus.
4. Draft chart and connect ratings
This step can occur in a program like Microsoft Excel: Enter your data in a spreadsheet, using either the consensus team rating, or an aggregate/median/mean of individual ratings.
You can also draw your radar chart by hand:
- Draw a large wheel with as many spokes as there are rating categories, and write each category at the end of its spoke
- Mark each spoke on a zero to "n" scale, with zero at the center (no performance) and the highest number at the outer ring (full performance)
- Connect the team ratings (or aggregated individual ratings)
5. Interpret chart
Use the chart to view the biggest gaps between current and ideal performance, and focus on improving the largest gap in the most critical category.
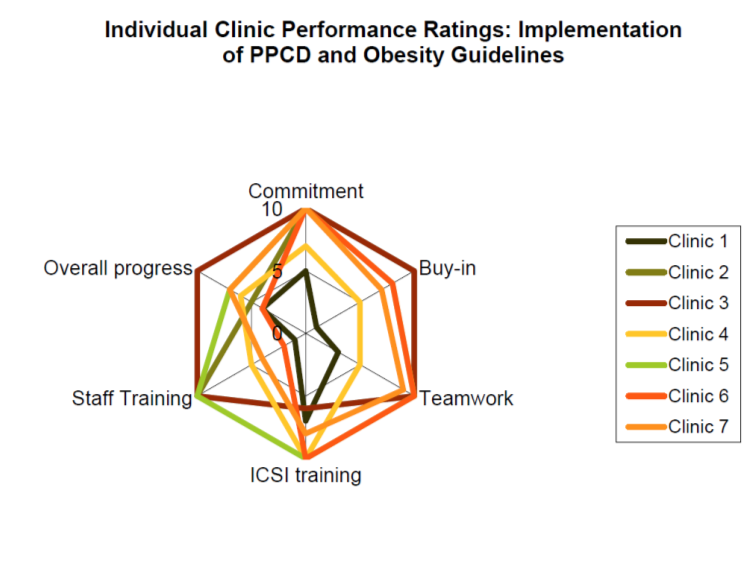
Example radar chart
This radar chart from the Minneapolis Department of Health and Family Support, shows how seven different clinics meet PPCD and obesity guidelines.
More information
Present Your Data in a Radar Chart
Microsoft
Radar Chart (PDF)
National Network of Public Health Institutes
Finding the Right Tool for your Purpose (PDF)
MDH Office of Performance Improvement
Radar Chart [Note: Video will autoplay]
Western Regional Public Health Training Center
Sources
Public Health Memory Jogger
Public Health Foundation, GOAL/QPC
Finding the Right Tool for your Purpose (PDF)
MDH Office of Performance Improvement