Tools and Training
Run Chart
On this page:
What is a run chart?
How to create a run chart
Using a run chart to test for special causes
Examples of run charts
Further reading
Sources
What is a run chart?
A run chart is used to study collected data for trends or patterns over a specific period of time. A run chart will help you:
- Monitor data over time to detect trends, shifts, or cycles
- Compare a measure before and after the implementation of solution to measure impact
- Focus attention on vital changes, not normal variation
- Track useful information for predicting trends
The run chart is a running record of a process over time:
- The vertical axis represents the process being measured
- The horizontal axis represents the units of time by which the measurements are made
- The centerline of the chart is the mean or average
A run is defined as one or more consecutive data points on the same side of the mean line.
See Also: PH&QI Toolbox: Control Chart
How to create a run chart
- Choose which data you will measure and track
- Gather data: Generally, collect 20-25 data points, with which you can detect meaningful patterns over time
- Create a graph on which you can plot your data (y axis, or vertical line) over time (x axis, or horizontal line)
- Plot the data
- Interpret the chart: Focus on the vital changes or meaningful trends/patterns, rather than each and every data variation; keep reading for interpretation tips
Using a run chart to test for special causes
Test #1: The presence of too much or too little variability
Use when there are too few or too many runs.
Test #2: The presence of a shift in the process
A special cause exists if a run contains too many data points (i.e., with 20 or more data points, a run of 8 or more data points is considered "too long"; with less than 20 data points, a run of 7 might also be considered "too long").
Test #3: The presence of a trend
A trend is defined as an unusually long series of consecutive increases or decreases in the data, (usually at least 6 or 7).
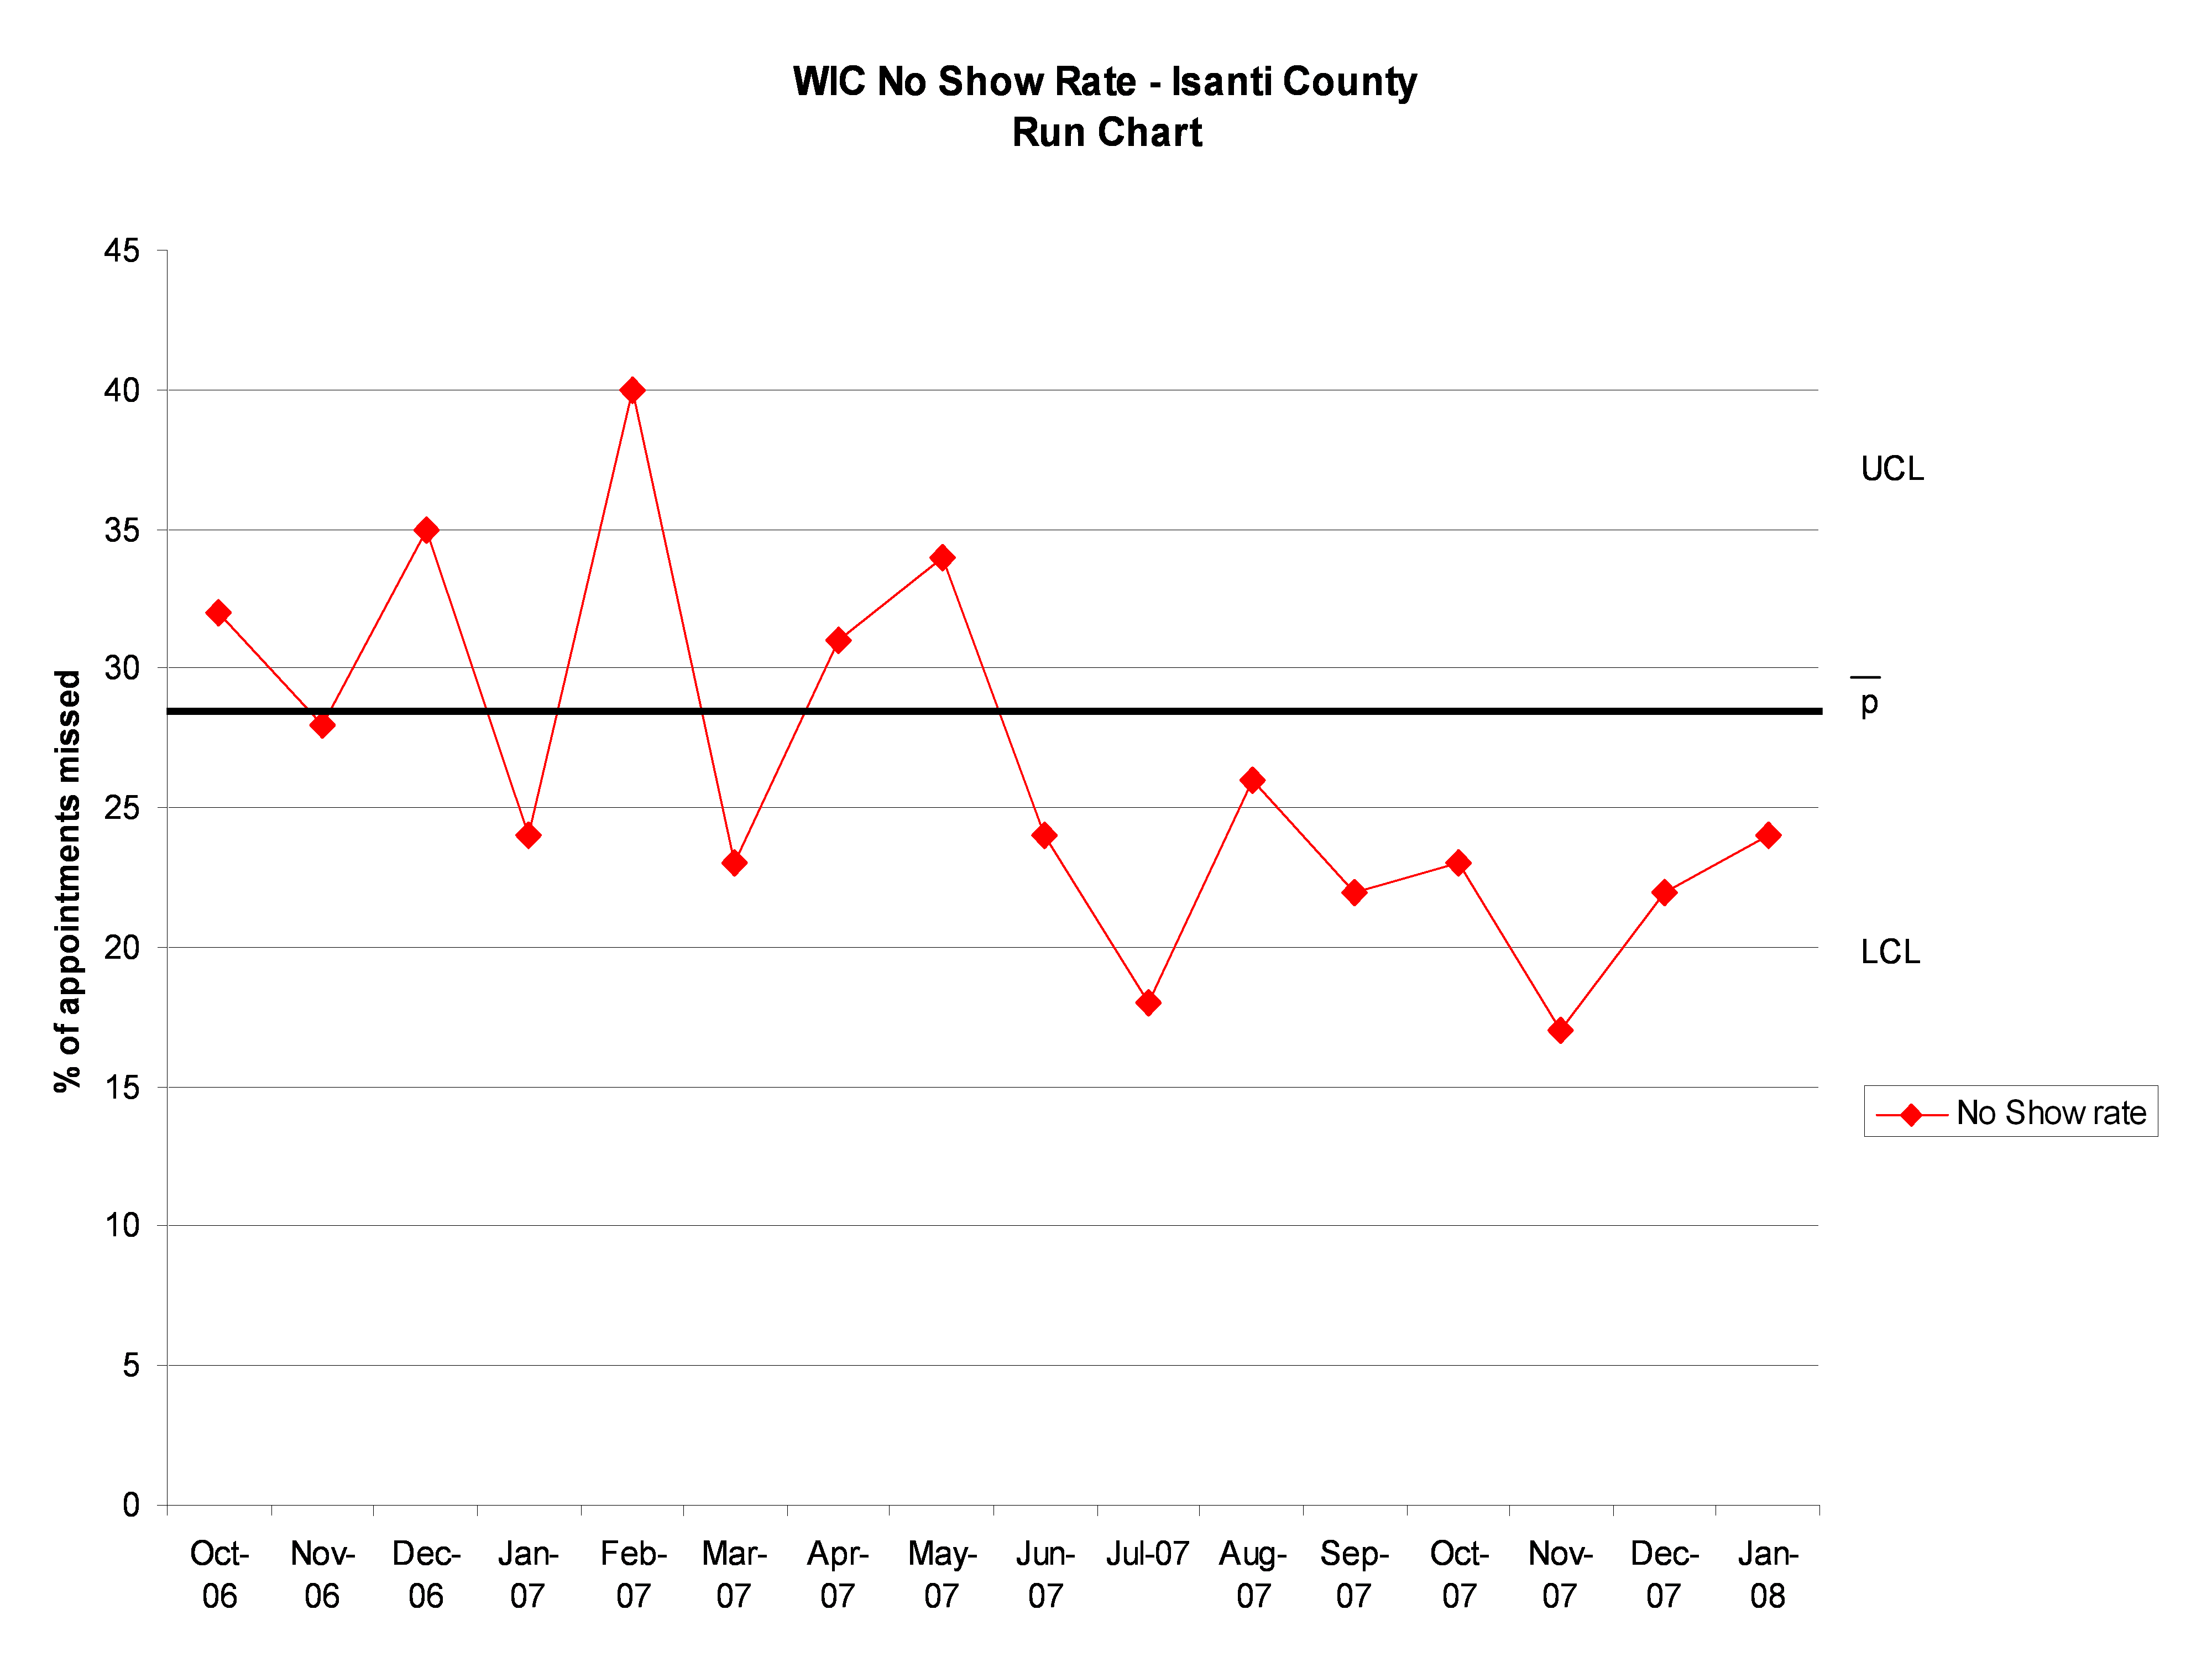
Examples of run charts
Isanti County, WIC no-show rate
This run chart from Isanti County shows the percentage of WIC appointments missed over a 1.5-year period.
Click to view larger image.
More examples of run charts
The Use of Control Charts in Health-Care and Public-Health Surveillance (PDF)
Journal of Quality Technology
Plotting Basic Control Charts: Tutorial Notes for Healthcare Practitioners (PDF)
Quality and Safety in Health Care
Further reading
Basics of the Control Chart (PDF)
MDH Office of Performance Improvement / UMN School of Public Health
Control Chart
American Society for Quality
The Control Chart: An Epidemiological Tool for Public Health Monitoring
Public Health
Finding the Right Tool for your Purpose (PDF)
MDH Office of Performance Improvement
Sources
Public Health Memory Jogger
Public Health Foundation, GOAL/QPC
Basics of the Control Chart (PDF)
MDH Office of Performance Improvement / UMN School of Public Health