Cardiovascular Health
- Cardiovascular Health Home
- CVH Data and Trends
- CVH Programs & Resources
- Minnesota 2035 Plan
- Minnesota Stroke Program
- About Us
Learn More
Related Topics
Cardiovascular Health Indicator
Measure: Stroke Hospitalization Rate
| Indicator | Date of Most Recent Measure | Current Measure | Trend |
|---|---|---|---|
| Age-Adjusted Hospitalization Rate due to Cerebrovascular Disease (Stroke) | 2021 | 185.3 per 100,000 |
Stable |
Overview
- In 2021, there were just over 12,800 hospitalizations of Minnesotans for stroke, or a rate of 185 hospitalizations per 100,000 people.
- The total number of annual stroke hospitalizations has stayed relatively steady from 2005 through 2015, increased almost 1,800 from 2015 to 2019, and dropped significantly in 2020, the first year of the COVID-19 pandemic. Hospitalizations increased in 2021, back to levels last seen in 2017.
- The lowest stroke hospitalization rate in Minnesota was in 2015; the rate has increased slightly through 2019, before dropping significantly in 2020. It is unclear if these recent changes are a trend or are temporary impacts of the COVID-19 pandemic.
- The long-term decline in stroke hospitalization rates is limited to adults ages 65 and older. Adults younger than 65 have experienced slight increases in hospitalization rates between 2005 and 2019. Young adults ages 18 to 44 continued to see hospitalization rates increase during 2020, the first year of the COVID-19 pandemic.
See Also:
Analysis
As shown in Table 1, the total number of hospitalizations of Minnesotans due to stroke and transient ischemic attacks (TIA) has remained fairly stable from 2007 through 2015, followed by an increase of more than 1,700 annual hospitalizations through 2019. TIAs are temporary blockages in the blood supply to the brain. Sometimes these are called “mini-strokes.” The rate of hospitalization for all stroke and TIA declined in a steady fashion, until leveling out in recent years, as shown in Chart 1. The average hospitalization rate was relatively stable from 2015 through 2019, before dropping significantly in 2020, the first year of the COVID-19 pandemic.
Table 1: Total Hospitalizations and Hospitalization Rate due to Stroke and TIA for all Minnesotans, 2007-2021
| Year | Number of Hospitalizations | Age-Adjusted Hospitalization Rate (per 100,000) |
|---|---|---|
| 2007 | 11,538 | 211.7 |
| 2008 | 11,714 | 210.6 |
| 2009 | 11,810 | 209.3 |
| 2010 | 11,640 | 201.6 |
| 2011 | 12,018 | 204.9 |
| 2012 | 12,395 | 206.4 |
| 2013 | 11,943 | 194.8 |
| 2014 | 11,893 | 190.0 |
| 2015 | 12,011 | 188.1 |
| 2016 | 12,350 | 189.4 |
| 2017 | 12,812 | 193.0 |
| 2018 | 13,359 | 196.6 |
| 2019 | 13,768 | 199.3 |
| 2020 | 12,300 | 179.1 |
| 2021 | 12,809 | 185.3 |
Chart 1: Age-adjusted Hospitalization Rate due to Stroke and TIA for all Minnesotans, 2007-2021
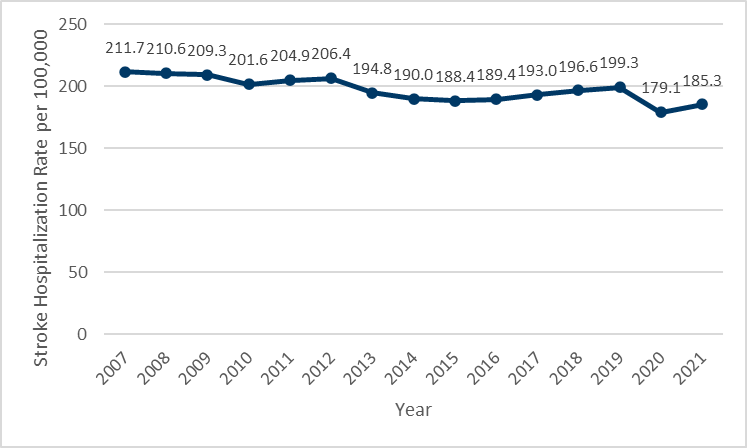
Table 2 shows the number of hospitalizations and hospitalization rate by year for younger (ages 18-44), middle-aged (ages 45-64), and older (ages 65+) adults. In each year, the vast majority of hospitalizations is occurring in older adults 65 years and older. The overall decline in the rate of stroke and TIA hospitalization rates appears to be driven exclusively by declines in the rate of stroke among older adults aged 65 or older.
Table 2: Total Hospitalizations and Hospitalization Rate due to Stroke and TIA for adult Minnesotans by age group, 2007-2021
| Year | Number of Hospitalizations, ages 18-44 years | Hospitalization Rate, ages 18-44 years (per 100,000) | Number of Hospitalizations, ages 45-64 years | Hospitalization Rate, ages 45-64 years (per 100,000) | Number of Hospitalizations, ages 65+ | Hospitalization Rate, ages 65+ years (per 100,000) |
|---|---|---|---|---|---|---|
| 2007 | 542 | 28.2 | 2,731 | 201.4 | 8,226 | 1280.7 |
| 2008 | 546 | 28.5 | 2,786 | 201.0 | 8,334 | 1265.0 |
| 2009 | 498 | 26.1 | 2,861 | 201.9 | 8,410 | 1250.6 |
| 2010 | 520 | 27.4 | 2,967 | 205.7 | 8,113 | 1182.1 |
| 2011 | 564 | 29.6 | 3,096 | 211.8 | 8,306 | 1185.1 |
| 2012 | 557 | 29.2 | 3,139 | 214.7 | 8,652 | 1185.2 |
| 2013 | 559 | 29.1 | 2,947 | 201.2 | 8,400 | 1111.9 |
| 2014 | 538 | 28.0 | 3,061 | 208.7 | 8,244 | 1057.1 |
| 2015 | 529 | 27.5 | 3,118 | 212.2 | 8,308 | 1035.8 |
| 2016 | 565 | 29.2 | 3,319 | 226.1 | 8,426 | 1,015.2 |
| 2017 | 601 | 30.8 | 3,323 | 227.8 | 8,844 | 1029.3 |
| 2018 | 609 | 30.9 | 3,400 | 235.1 | 9,296 | 1044.7 |
| 2019 | 612 | 30.8 | 3,519 | 246.1 | 9,584 | 1041.3 |
| 2020 | 649 | 32.3 | 3,255 | 226.0 | 8,346 | 897.4 |
| 2021 | 642 | 31.9 | 3,263 | 229.6 | 8,855 | 926.6 |
Chart 2A shows the rate of hospitalizations for stroke for 18-44 year olds. Between 2007 and 2016, the overall rate remained essentially unchanged, hovering between 26 and 30 hospitalizations per 100,000 per year. Since 2017, the hospitalization rate has exceeded 30 per 100,000 per year, higher than in any year going back to 2007. Despite large drops in overall stroke hospitalizations in the first year of the COVID-19 pandemic, the number of stroke hospitalizations in younger adults increased again in 2020, and was almost 25% higher than in 2009.
Chart 2A: Hospitalization Rate due to Stroke and TIA for Minnesotans ages 18-44, 2007-2021
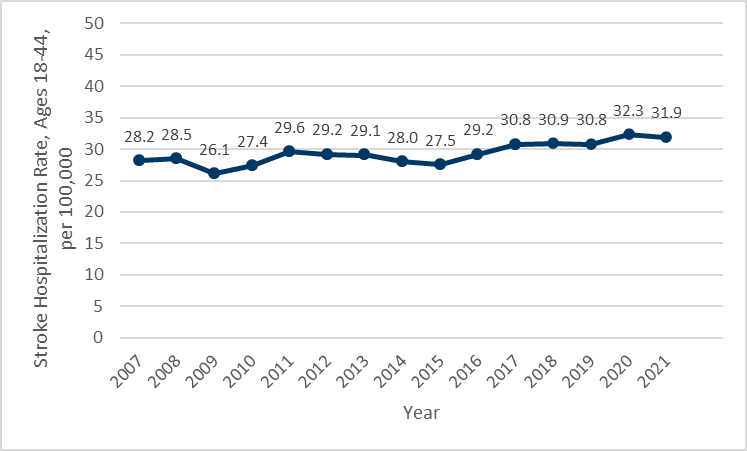
Chart 2B shows the hospitalization rate for stroke for 45-64 year olds. Like for younger adults, the overall hospitalization rate has remained essentially unchanged over the 2007 to 2015 time period, hovering between 201 and 215 hospitalizations per 100,000 per year. Between 2015 and 2019, the rate increased by 34 hospitalizations per 100,000 per year, or about 17%. In 2020, the hospitalization rate dropped by more than 8%, with only a small increase in 2021. It is unclear if these recent changes are a trend or are temporary impacts of the COVID-19 pandemic.
Chart 2B: Hospitalization Rate due to Stroke and TIA for Minnesotans ages 45-64, 2007-2021
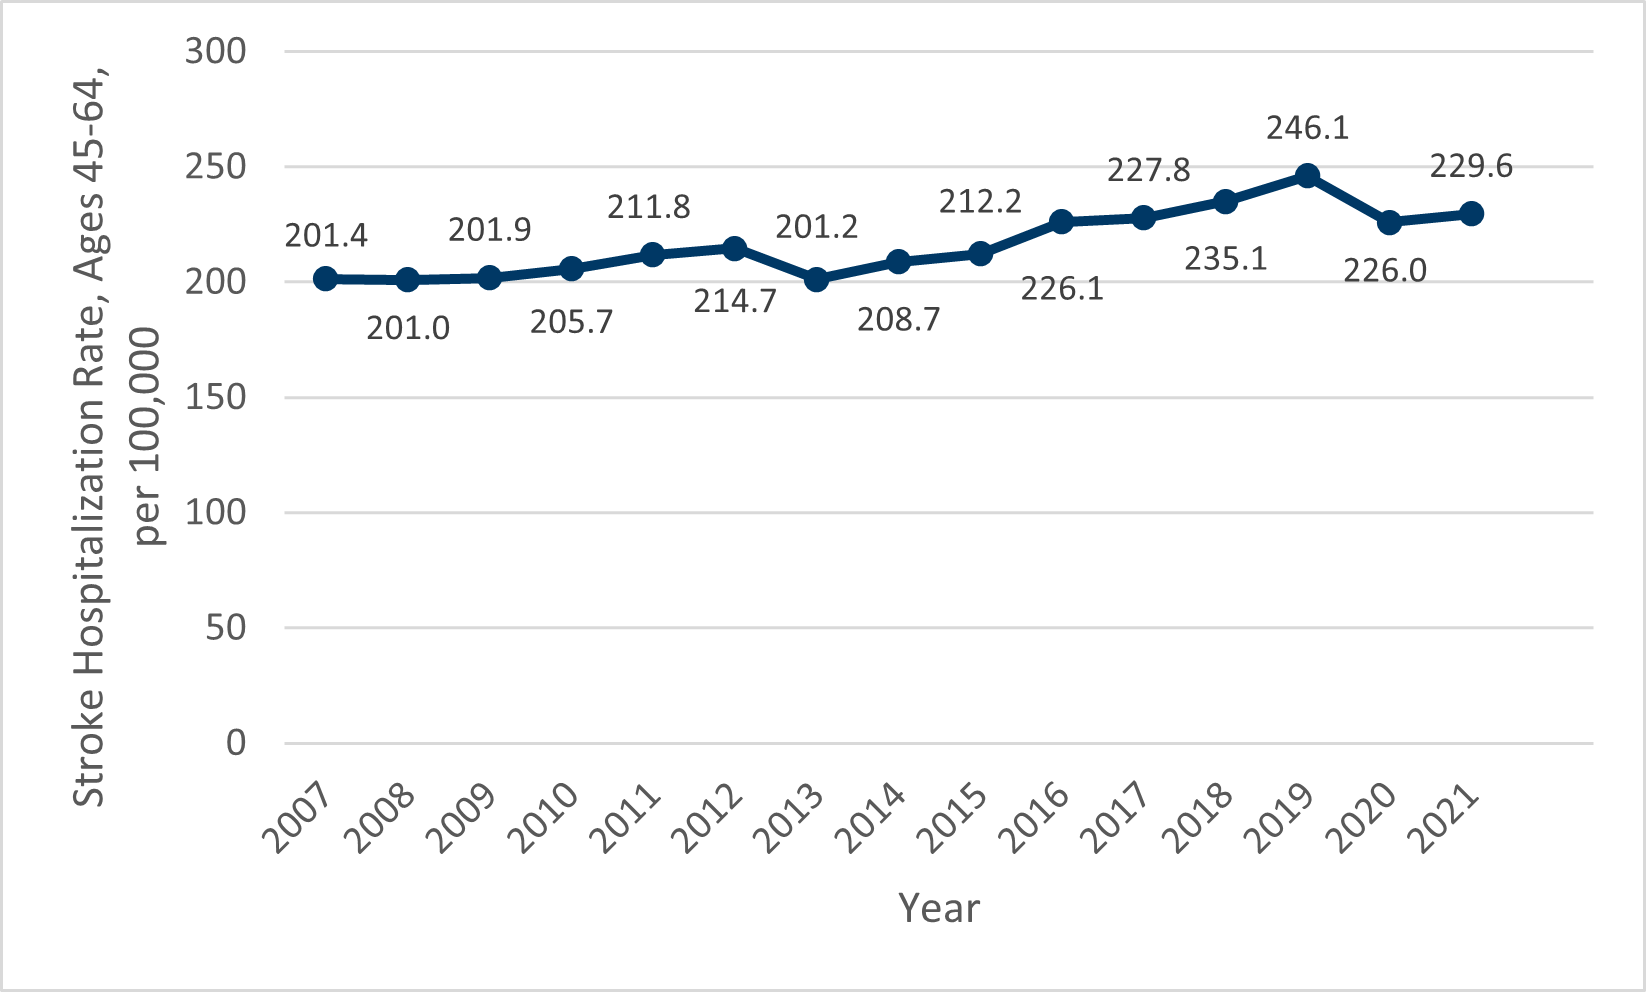
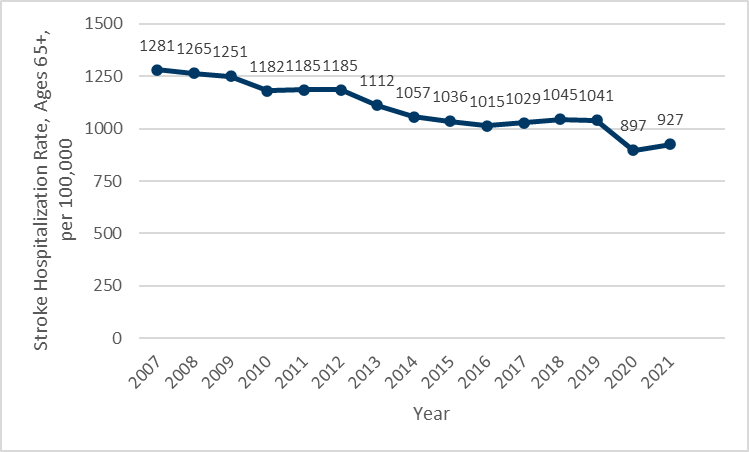
Chart 2C shows the rate of hospitalizations for stroke for individuals 65 years and older. Between 2007 and 2016, the overall rate dropped by 343 hospitalizations per 100,000 per year, or about 25%. Unlike in the younger and middle-aged adults, this long-term decline was consistent through 2016, followed by very little change in the hospitalization rate from 2016 through 2019. In 2020, the hospitalization rate dropped by 14%, with an increase of 3% in 2021. It is unclear if these recent changes are a trend or are temporary impacts of the COVID-19 pandemic.
Chart 2C: Hospitalization Rate due to Stroke and TIA for Minnesotans ages 65+, 2007-2021