Fish Consumption
- Fish Consumption Home
- Waterbody-specific, Northeast, and Statewide Guidelines
- Contaminants and Minnesota Fish
- Order Fish Consumption Materials
- Eating Fish: Benefits and Serving Size
- Resources, Reports & Technical Information
- Great Lakes Consortium
- Information in Other Languages
Related Topics
Environmental Health Division
Contact Info
Updated Mercury Analyses for Fish Consumption Guidelines
Updated February 2026
This page provides additional background on the updated mercury analyses the Fish Consumption Guidance program uses to determine consumption guidance for fish caught in Minnesota lakes. Scientists from Minnesota’s Fish Contaminant Monitoring Program (FCMP) published these analyses in 2024 (Radomski et al. 2024). Mercury is a toxicant that impacts the kidneys, liver, and nervous system. The most sensitive life stages for neurotoxicity occur during pregnancy to the fetus, and in infancy through childhood when understanding and learning can be impacted. Fish absorb mercury, specifically methylmercury, from their food, where it then binds to proteins in the fish tissue. Over time, fish can accumulate relatively high mercury concentrations.
As we learn more about mercury in fish across the state, Minnesota Department of Health (MDH) updates our guidance. Check the Fish Consumption Guidance homepage for the most current information.
We have updated our analyses to estimate the average mercury concentrations in fish caught from lakes
The improved analyses increase the accuracy and confidence in the estimate of the average mercury concentrations in fish tissue by lake and fish species. Specifically, this approach:
- Expands our use of information previously used on a limited basis, like a fish’s length.
- Includes additional information, such as lake characteristics and fish mercury levels over time.
- Leverages data from over 43,000 fish samples from 1,396 lakes tested across Minnesota since 1967. This doubles the number of samples available compared to the prior approach that relied on sample data mainly from the previous 10 years.
These improved analyses help us better understand mercury in fish in lakes by looking at the species and length of fish eaten and where they were caught
Fish Length
Longer fish tend to have higher mercury concentrations. For example, the figure below shows how longer walleye in Crane Lake tend to have higher mercury concentrations:
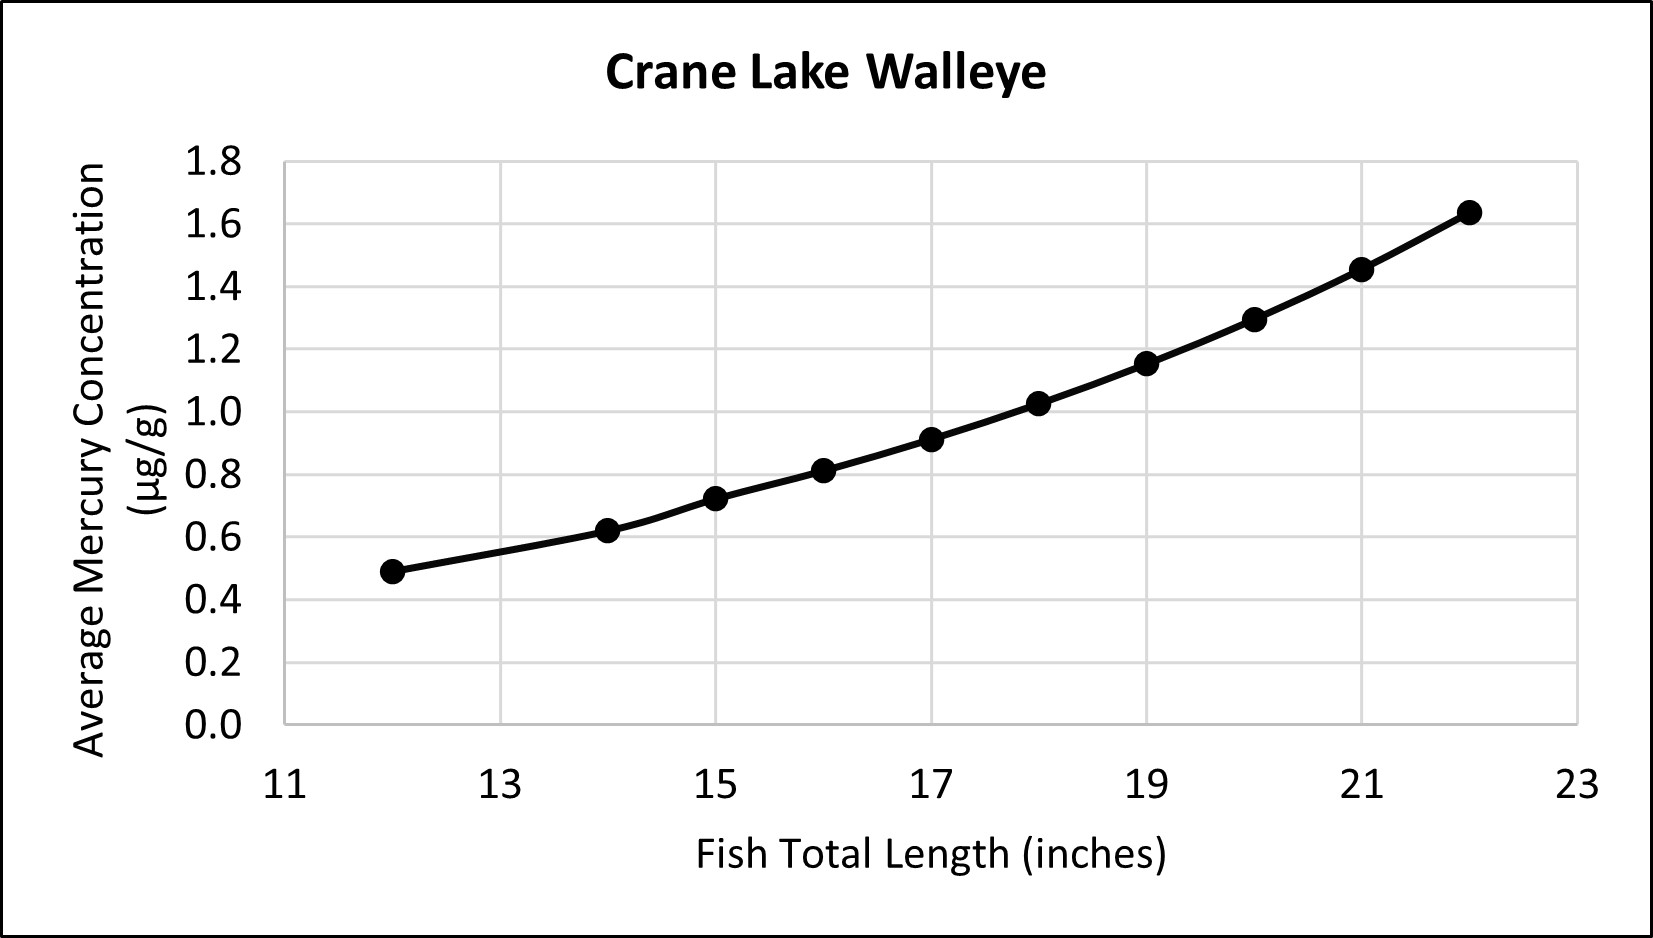
Fish Total Length (inches) Average Mercury Concentrations (µg/g) 12 0.49 14 0.62 15 0.72 16 0.81 17 0.91 18 1.03 19 1.15 20 1.26 21 1.46 22 1.64 - Because people eat a variety of fish sizes, the improved analyses use the average length of fish typically harvested. The analyses estimate mercury concentrations for these standard lengths of nine species in all sampled lakes. The nine species include black crappie, bluegill, lake trout, largemouth bass, northern pike, smallmouth bass, walleye, white sucker, and yellow perch.
Fish Species
- Predator species like northern pike or walleye tend to have higher mercury concentrations than prey species like black crappie or bluegill. This is because predator fish accumulate mercury from their prey.
- The improved analyses generate estimates of mercury concentrations by fish length and species for each sampled lake. This is used to make length-based fish consumption guidelines that are compared with MDH’s contaminant thresholds.
Lake Location
- A lake’s location affects fish mercury concentrations.
Mercury is released into the air primarily from human sources that can be local to global and settles into water and accumulates in fish. Fish from lakes in Northeast Minnesota generally have higher mercury concentrations than fish from lakes in other regions of the state. This is due to regional differences in mercury deposition, as well as environmental and other factors. The differences are explored in the following figure:
Some species of fish tend to have higher concentrations of mercury based on where the lake is in Minnesota
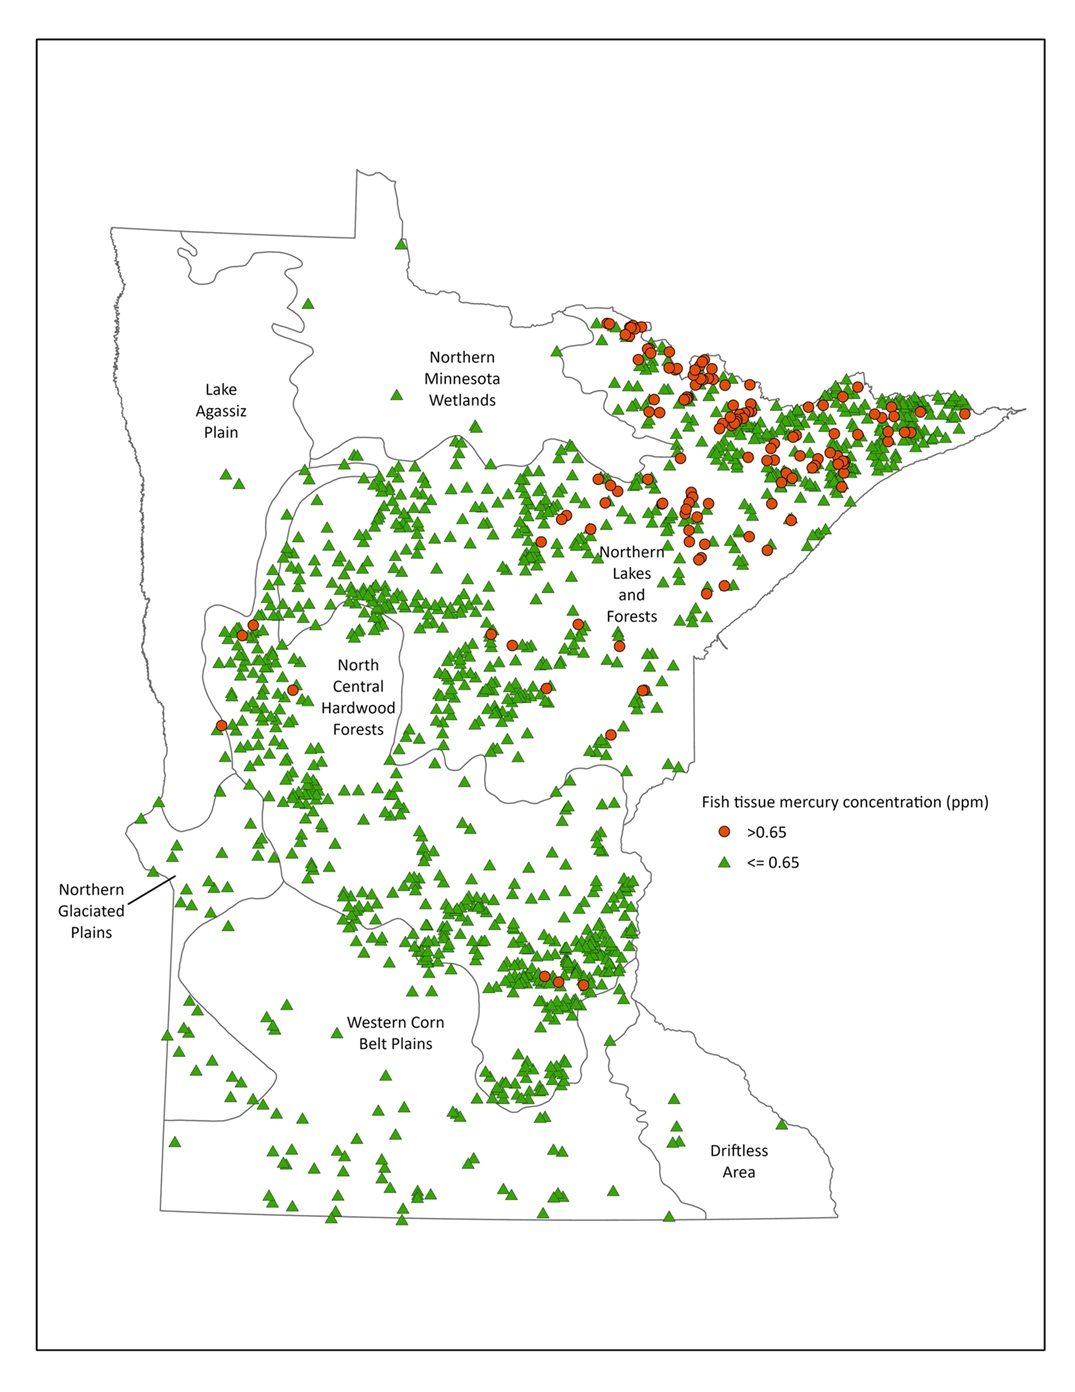 Estimated Average Mercury Concentrations of Species with the Highest Mercury Concentrations in the sampled lake by Ecoregion.
Source paper listed under Papers Cited- In the figure, lakes shown as red circles are where fish mercury concentrations are higher. Concentrations equal to and below 0.65 parts per million (ppm) are shown as green triangles.
- Northern lakes also generally have slower growing fish, which may result in more time for mercury to accumulate in the fish.
Lake Properties
- A lake’s physical and chemical properties also affect fish mercury concentrations.
- Generally, as mercury concentrations increase in surface water, mercury concentrations increase in fish. The form of mercury that accumulates in fish is primarily methylmercury.
- Wetlands discharge brown-colored water and mercury to lakes. Lakes with more wetland areas within their watersheds often have dark or brown-colored water and fish with elevated mercury concentrations. The University of Minnesota’s remote sensing lab provides colored dissolved organic-matter data for most Minnesota lakes, and this information can be used to assess mercury levels in fish tissue.
- Lakes with invasive zebra mussels generally have slightly higher fish mercury concentrations, likely because zebra mussels change the food web in lakes.
Our plans for new guidelines are based on where the fish came from, its species, and, for northern pike and walleye, the fish’s length
- We plan to add regional fish consumption guidelines specifically for Northeast Minnesota that include Cook, Lake, and St. Louis counties. Inclusion of the regional guidelines is an effort to reduce overall fish consumption guideline complexity and to reduce mercury exposure from consumption of some fish species with higher mercury concentrations in this part of the state.
- Past guidelines had many lakes in the Northeast with waterbody-specific guidelines that are more restrictive than the general Statewide Fish Consumption Guidelines. The Northeast Fish Consumption Guidelines reduce the complexity of finding the correct consumption guidelines because of fewer Waterbody Specific Fish Consumption Guidelines.
- Adding Northeast Fish Consumption Guidelines will create more protective guidelines for waterbodies in this region that have not been tested. In the past, lakes that have not been tested in the Northeast did not have more stringent waterbody-specific guidelines because we lacked the data to create them. Fish mercury levels in lakes tested in this region show that more stringent guidelines are likely necessary for some species.
- We plan to add recommended fish lengths to our guidelines for sensitive populations for walleye and northern pike. This change improves our guidelines to protect sensitive populations. By choosing to eat fish shorter than the length guidance, you can be more confident that those fish are lower in mercury.
The improved analyses have additional benefits
- The improved mercury analyses will allow more efficient and targeted sampling of fish, and the program will use these saved resources for other FCMP ─ interagency team with MDH, the Minnesota Department of Natural Resources, and the Minnesota Pollution Control Agency that leads the State’s fish contaminant activities ─ priorities like per- and poly-fluoroalkyl substance (PFAS) sampling and analyses.
- The application of the improved analyses and the addition of a regional guideline will reduce the overall number of waterbody-specific guidelines, which improves our guidance’s clarity and usability.
- The existing Waterbody Specific Fish Consumption Guidelines for some lakes were based on older data because the lakes have not been recently sampled. The improved analyses provide more accurate recommendations for these lakes by considering more recent data.
- The FCMP continues to collect fish contaminant data annually and update the analyses and guidance as needed.
The way we estimate mercury concentrations in fish in Lake Superior, rivers, and some lakes is staying the same
- For some fish species in lakes and waterbodies where the improved analyses cannot be applied due to unavailable data, the existing analyses that use sample averages will continue.
Papers cited:
Radomski, P., Brentrup, J. A., Acquah, S., Preimesberger, A. L., & Kvit, A. (2024). Spatiotemporal variation in fish mercury contamination: Comparing approaches for crafting consumption advisories and assessing impairment. Journal of Environmental Management, 370, 122992.
Full article available upon request
For more information on health benefits of eating fish or guideline clarity, please contact Fish Consumption Guidance at health.fish@state.mn.us.