Climate & Health
- Climate and Health Home
- About Us
- Climate and Health in Minnesota
- Agriculture and Food Security
- Air Quality
- Diseases Spread by Ticks and Mosquitoes
- Extreme Heat
- Planning for and Responding to Extreme Heat
- Water Changes
- Wellbeing
Resources
- Discussing Climate Change with Patients
- Minnesota Outdoor Air Quality Guidance for Schools and Child Care
- Climate and Health Stories
- Planning Tools and Publications
- Trainings and Resources
Related Topics
Environmental Health Division
Climate and Health in Minnesota
From extreme heat to ecosystem threats, real changes in Minnesota's climate are impacting the health of Minnesotans. Read through our Minnesota Climate and Health Profile Summary (PDF) for a little more detail.
While climate change impacts everyone, certain populations are more vulnerable to the health impacts of climate change. Vulnerability means the characteristics of a person or group and their situation that influence their capacity to anticipate, cope with, resist and recover from the impact of a natural hazard of other climate hazard. Learn more in our Minnesota Climate Change Vulnerability Assessment Summary (PDF).
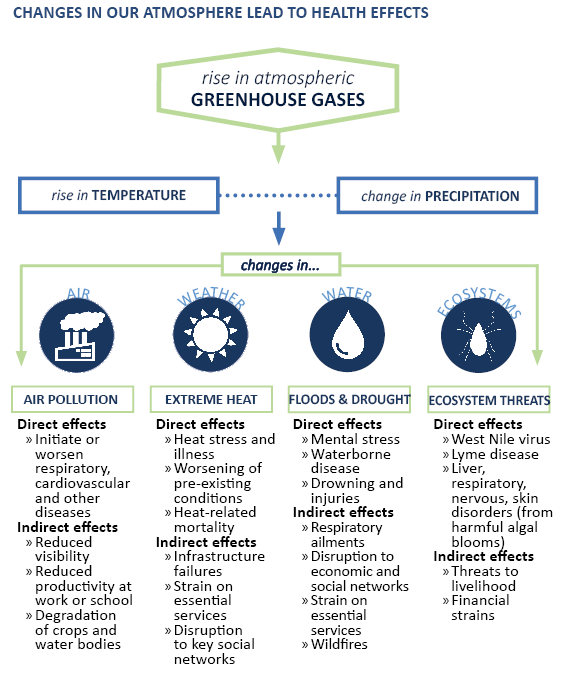
Changes in our atmosphere lead to health effects
Increases in greenhouse gas (GHG) emissions are leading to increases in ambient temperatures, which in turn are leading to extremes in precipitation.
Source: MDH, 2016
The full Minnesota Climate and Health Profile Report (PDF), published in 2015, provides a comprehensive assessment of climate change impacts and potential health burdens specific to Minnesota. The report explains the pathways between identified Minnesota climate hazards (i.e., air pollution, extreme heat, flood, drought and ecosystem threats, including vector-borne diseases and harmful algal blooms) and their corresponding health impacts.
Average annual all-season temperature for Minnesota
Minnesota has gotten noticeably warmer, especially over the last few decades. Since the beginning of the data record (1895) through 1959, Minnesota’s annual average temperature increased by nearly 0.2°F per decade, which is equivalent to over 2°F per century. This is shown in the graph at the left (below). This warming effect has accelerated over the last 50 plus years. Data from 1960-2016 show that the recent rate of warming for Minnesota has sped up substantially to over 0.5°F per decade, which is equivalent to 5.0°F per century. This is shown in the graph to the right (below).
Source: NOAA, 2017
Minnesota annual average precipitation
With a warming atmosphere, more evaporation occurs. The graph on the left (below) highlights the trend for the early part of the last century, 1895-1959, while the graph on the right (below) highlights the trend for the most recent half century, 1960-2016. For most of the first half of the 20th century, the trend in precipitation was slightly downward, at a loss of 0.2 inches per decade or the equivalent of -2 inches per century. This downward trend was influenced by the Dust Bowl years of the 1930s. However, the rate of precipitation across the state has increased by nearly 0.5 inches per decade or the equivalent of 5 inches per century over the last 50+ years.
Source: NOAA, 2017
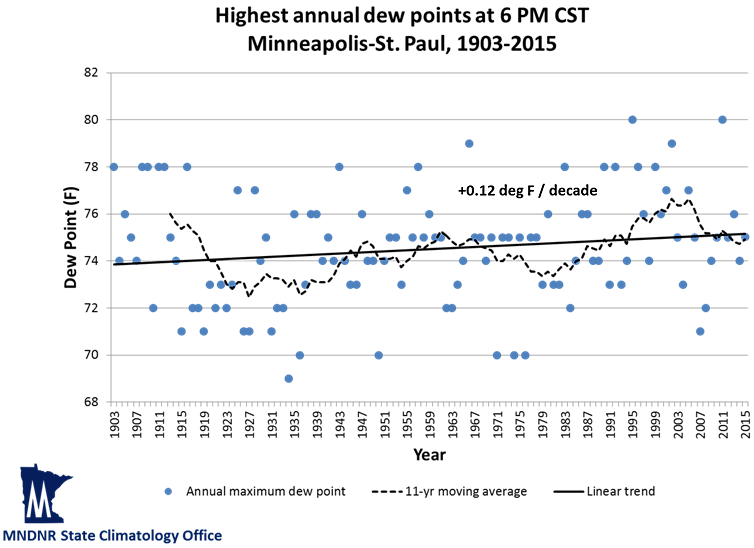
Highest twin cities annual dew points
While many measures of dew point and humidity in Minnesota do not yet show evidence of increasing, the most extreme dew point values are becoming more frequent and more extreme over time. Based on historical data, annual maximum dew point temperatures (measured at 6:00PM CST) are increasing in Minnesota.
Source: MN DNR State Climatology Office
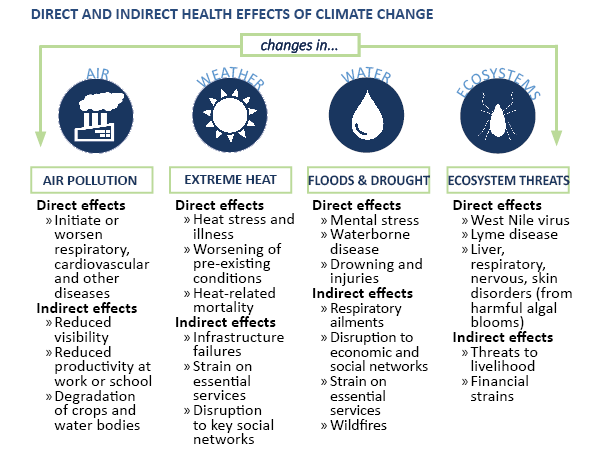
All of these atmospheric influences (GHG emissions, temperature, precipitation, humidity) are directly or indirectly causing disruptions in four key aspects of the human environment—air, weather, water, and ecosystems. Changes in these areas are in turn leading to situations that threaten the health and vitality of human communities through increased air pollution, extreme heat events, floods, droughts and ecosystem threats.
Direct and indirect health effects of climate change
Source: MDH, 2016
For example, increases in ambient air temperatures and humidity are predicted to increase the frequency, duration and severity of extreme heat events. Direct health effects from extreme heat include symptoms associated with heat stress, such as fatigue, cramps, headaches and nausea, or responses that are much more extreme, including heat stroke, organ failure, and even death.
In 2012, there were 1,715 emergency department visits and six deaths due to extreme heat. In addition, heat waves can exacerbate pre-existing medical conditions or diseases, such as diabetes, cardiovascular disease, chronic obstructive pulmonary disease, kidney ailments and mental or behavioral disorders. Indirect health effects from extreme heat include infrastructure failures like power outages; disruption of some occupations (especially those involving outdoor, strenuous labor), schooling, or major events, like athletic competitions or festivals; and a strain on emergency and health care services, in particular 911 response and emergency department operations.
For more information on climate change impacts on health, download the Minnesota Climate and Health Profile Report 2015 (PDF).
Health and climate change 101 training module
The MDH Climate & Health Program presented a Health & Climate Change 101 Training Webinar on Wednesday, July 26, 2017. The first in a six-part series focused on health and climate change issues in Minnesota, the webinar and training module provide an overview of the observed climate changes in Minnesota, the public health issues related to climate change, and public health strategies to mitigate and adapt to climate change to reduce the health impacts. The training module can be referenced as a general education tool or as a "train the trainer" module for local public health professionals.
Missed the session? View the webinar recording above.


